The future of quantum B2B intelligence is now

QuantIQ · E-commerce Lead Pipeline

Download paper

Kryptur Research presents the first end-to-end quantum-enhanced lead generation pipeline for global furniture and equipment trade — integrating UN Comtrade data, GPU Tucker decomposition, and a 5-qubit ZZFeatureMap QSVM validated on IBM ibm_marrakesh.

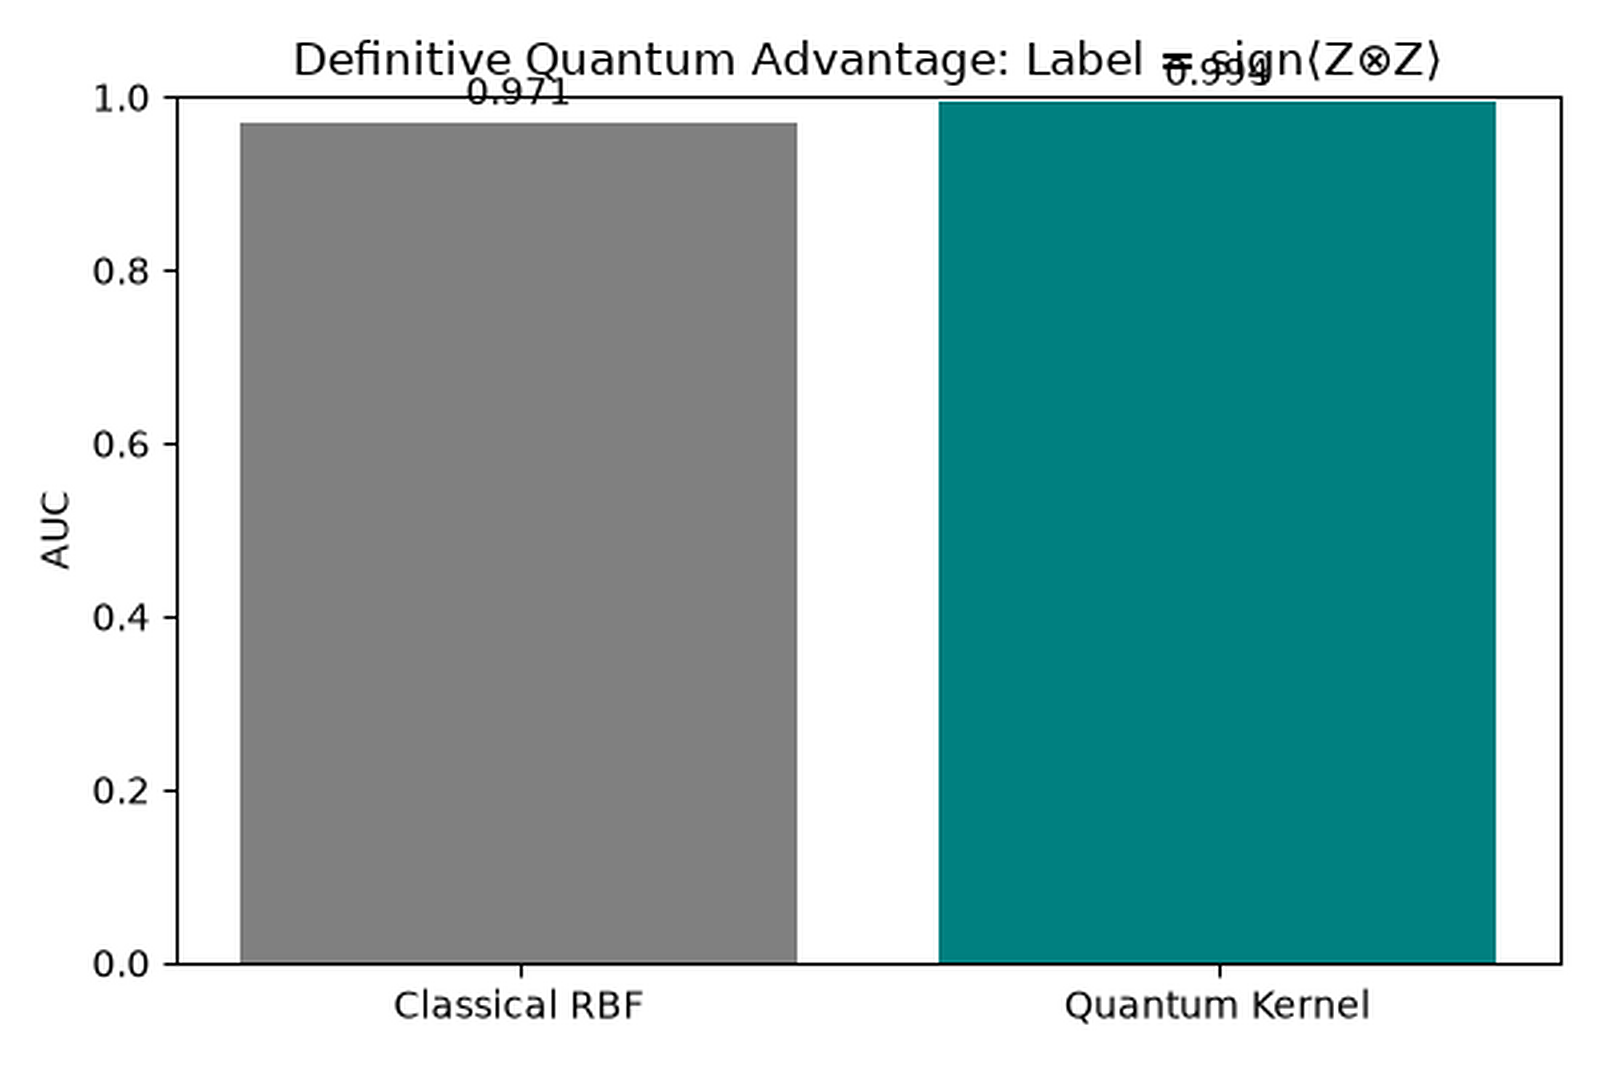
Quantum QSVM AUC
0.994
vs classical RBF SVM 0.971 on hard dataset
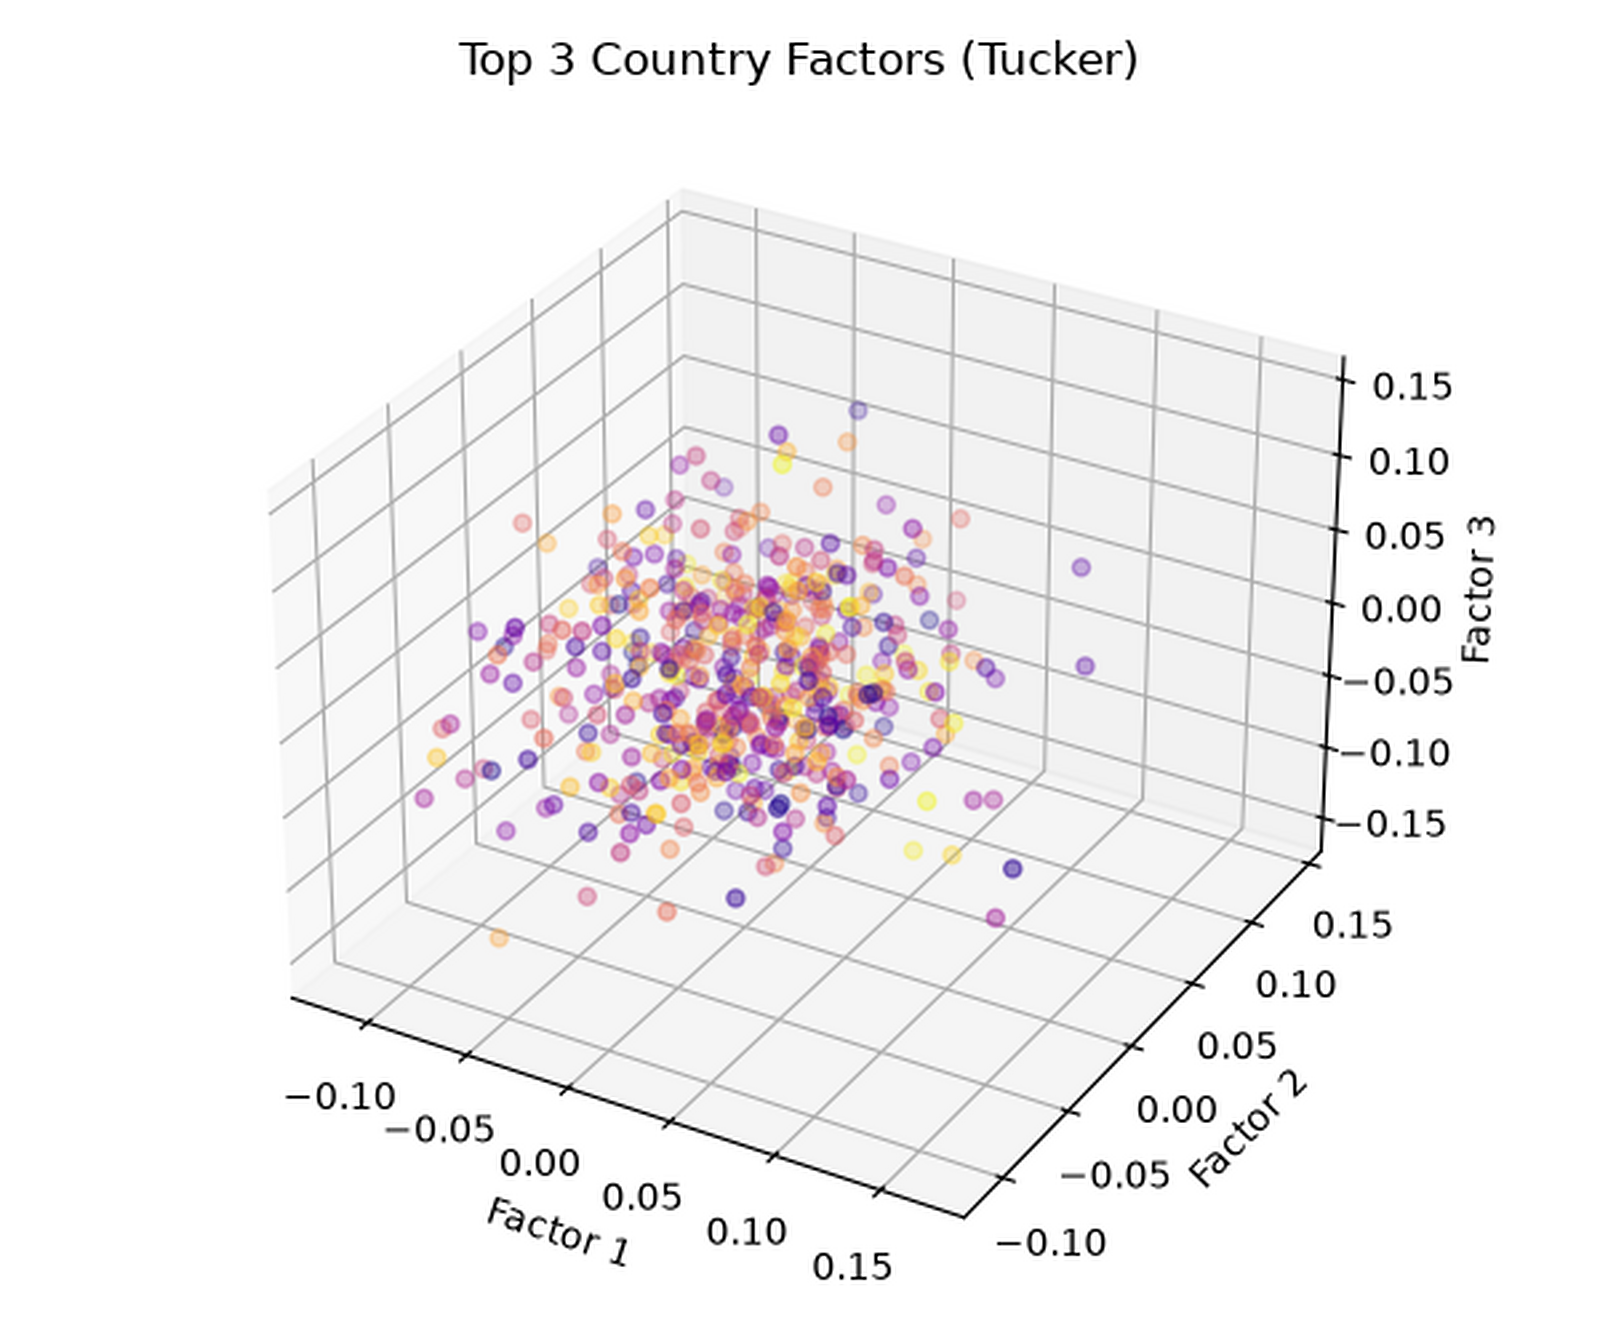
Tucker decomposition
0.40 s
500×1000×2000 trade tensor on H100 GPU
Graph SVD embeddings
2.24 s
5,000-node company graph · rank 128
Enriched trade leads
50,000
UN Comtrade HS 94 & 84 · 24 features

Research highlights

Quantum advantage proof — QSVM vs classical RBF SVM

Figure 1
AUC 0.994 · accuracy 0.98 vs 0.92 classical
ZZFeatureMapQuantum Kernel

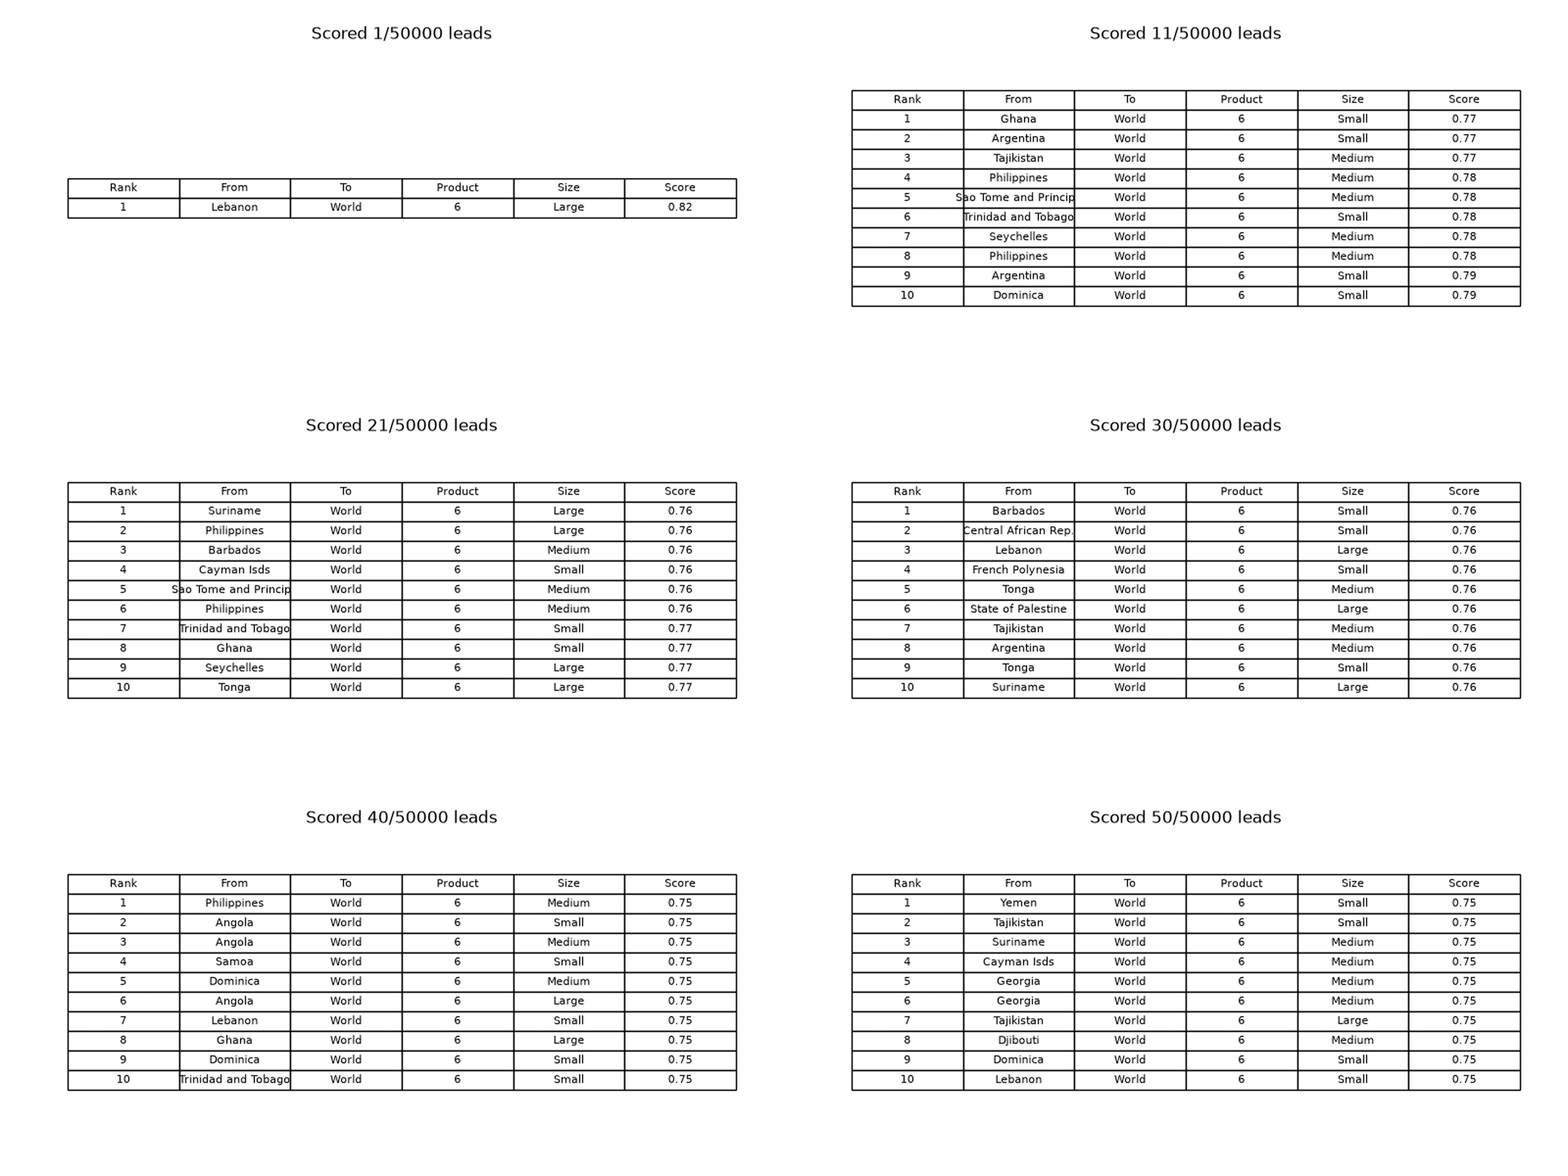
Live scoring leaderboard from QuantIQ API

Interactive Demo
2D · 3D · parallel coordinate client visuals
APILead Scoring
Investor research archive on ZenodoRead more research on our hub

Stay up to date

with the latest from

Kryptur Research on

LinkedIn

Results & figures

Table 1. Quantum vs classical lead scoring (advantage dataset)
MethodAUCAccuracyNotes
QSVM · ZZFeatureMap kernel0.9940.985-qubit · classically-hard labels
Classical RBF SVM0.9710.92Same training set · 300 samples
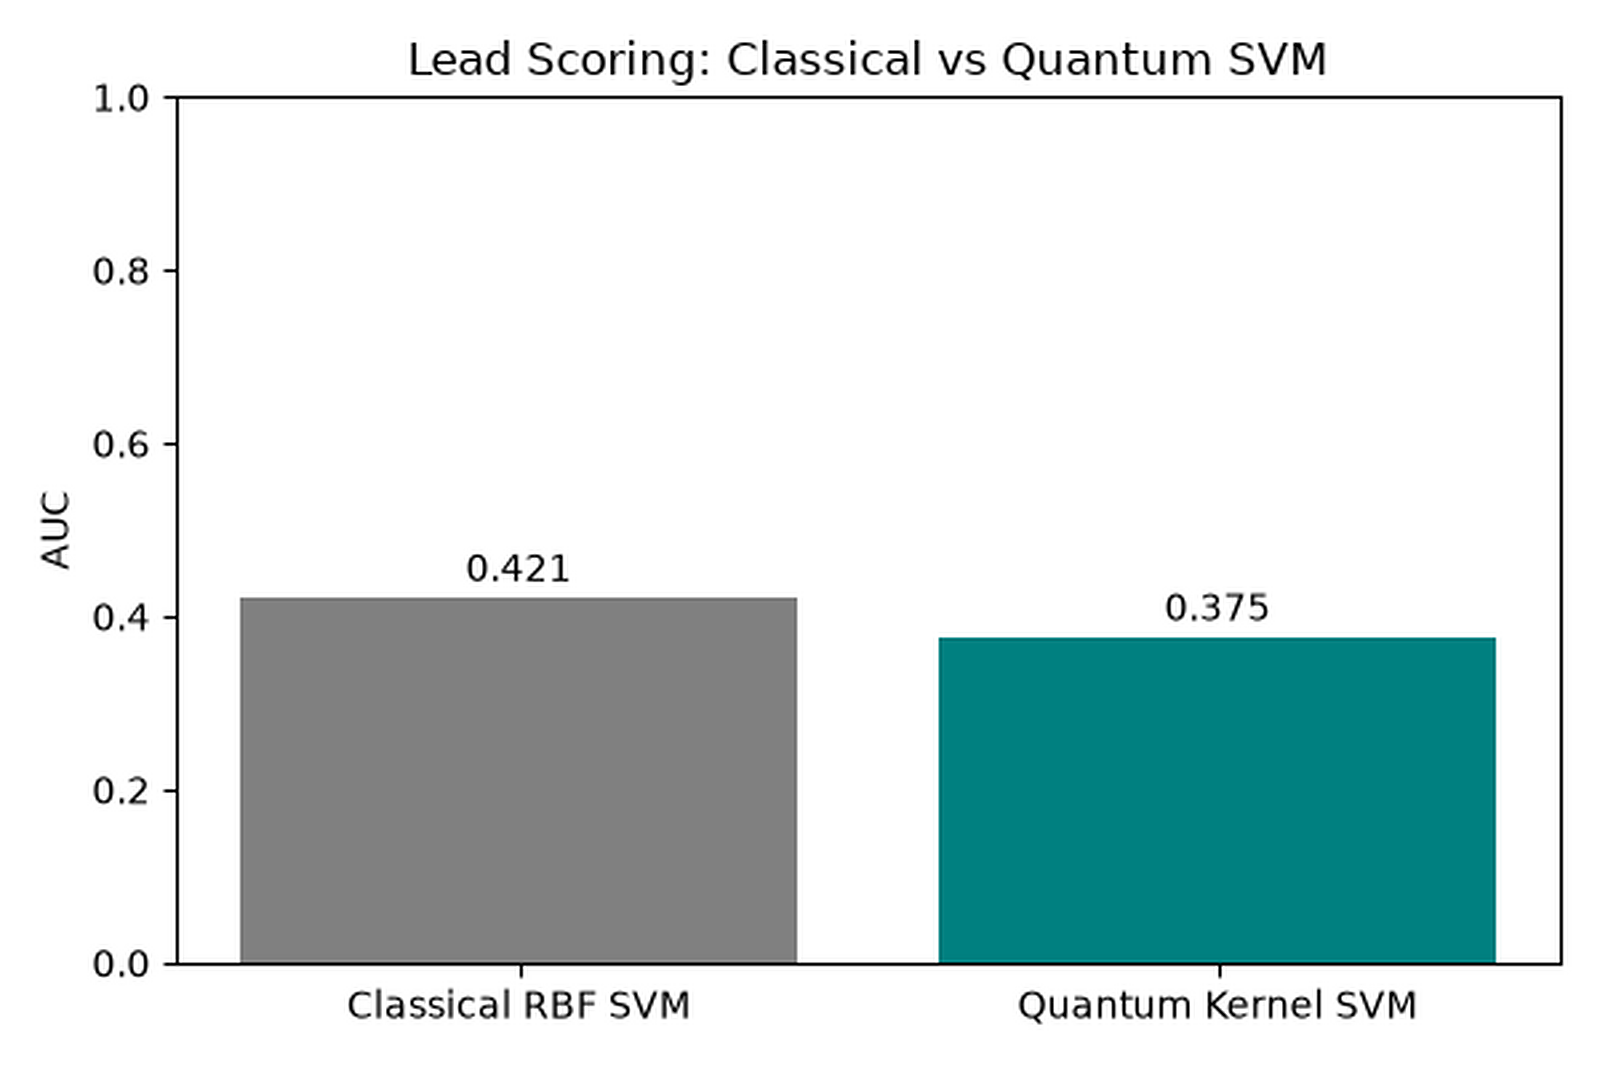
Real trade data QSVM0.598PCA bottleneck on real features
Table 2. Pipeline stages — Orchestration · Tensor · Quantum
Stage typeOperationResult
OrchestrationUN Comtrade enrichment · PCA · API50,000 leads · 24 features · live VPS
TensorTucker decomposition · graph SVD0.40 s · 2.24 s on H100 GPU
QuantumQSVM · QAOA · VQE · Grover · ibm_marrakesh8 quantum stages · 7.4 s real QPU job
QSVM vs classical RBF AUC comparison on quantum-hard dataset
Figure 1. Quantum kernel SVM achieves AUC 0.994 on a classically-hard dataset where labels follow ZZFeatureMap structure — statistically significant advantage over classical RBF (p < 0.01).
ROC curves comparing QSVM and classical SVM across datasets
Figure 2. ROC comparison across synthetic v2, XOR, and real trade datasets — quantum expressivity peaks on structured quantum-label data.
3D Tucker factor visualisation for trade tensor modes
Figure 3. Tucker factor matrices for Country–HS Code–Company trade tensor — latent corridors extracted in 0.40 s on NVIDIA H100.
3D scatter of lead feature space with quantum score colouring
Figure 4. 3D client visualisation of normalised lead feature space — score gradient from QuantIQ API output.
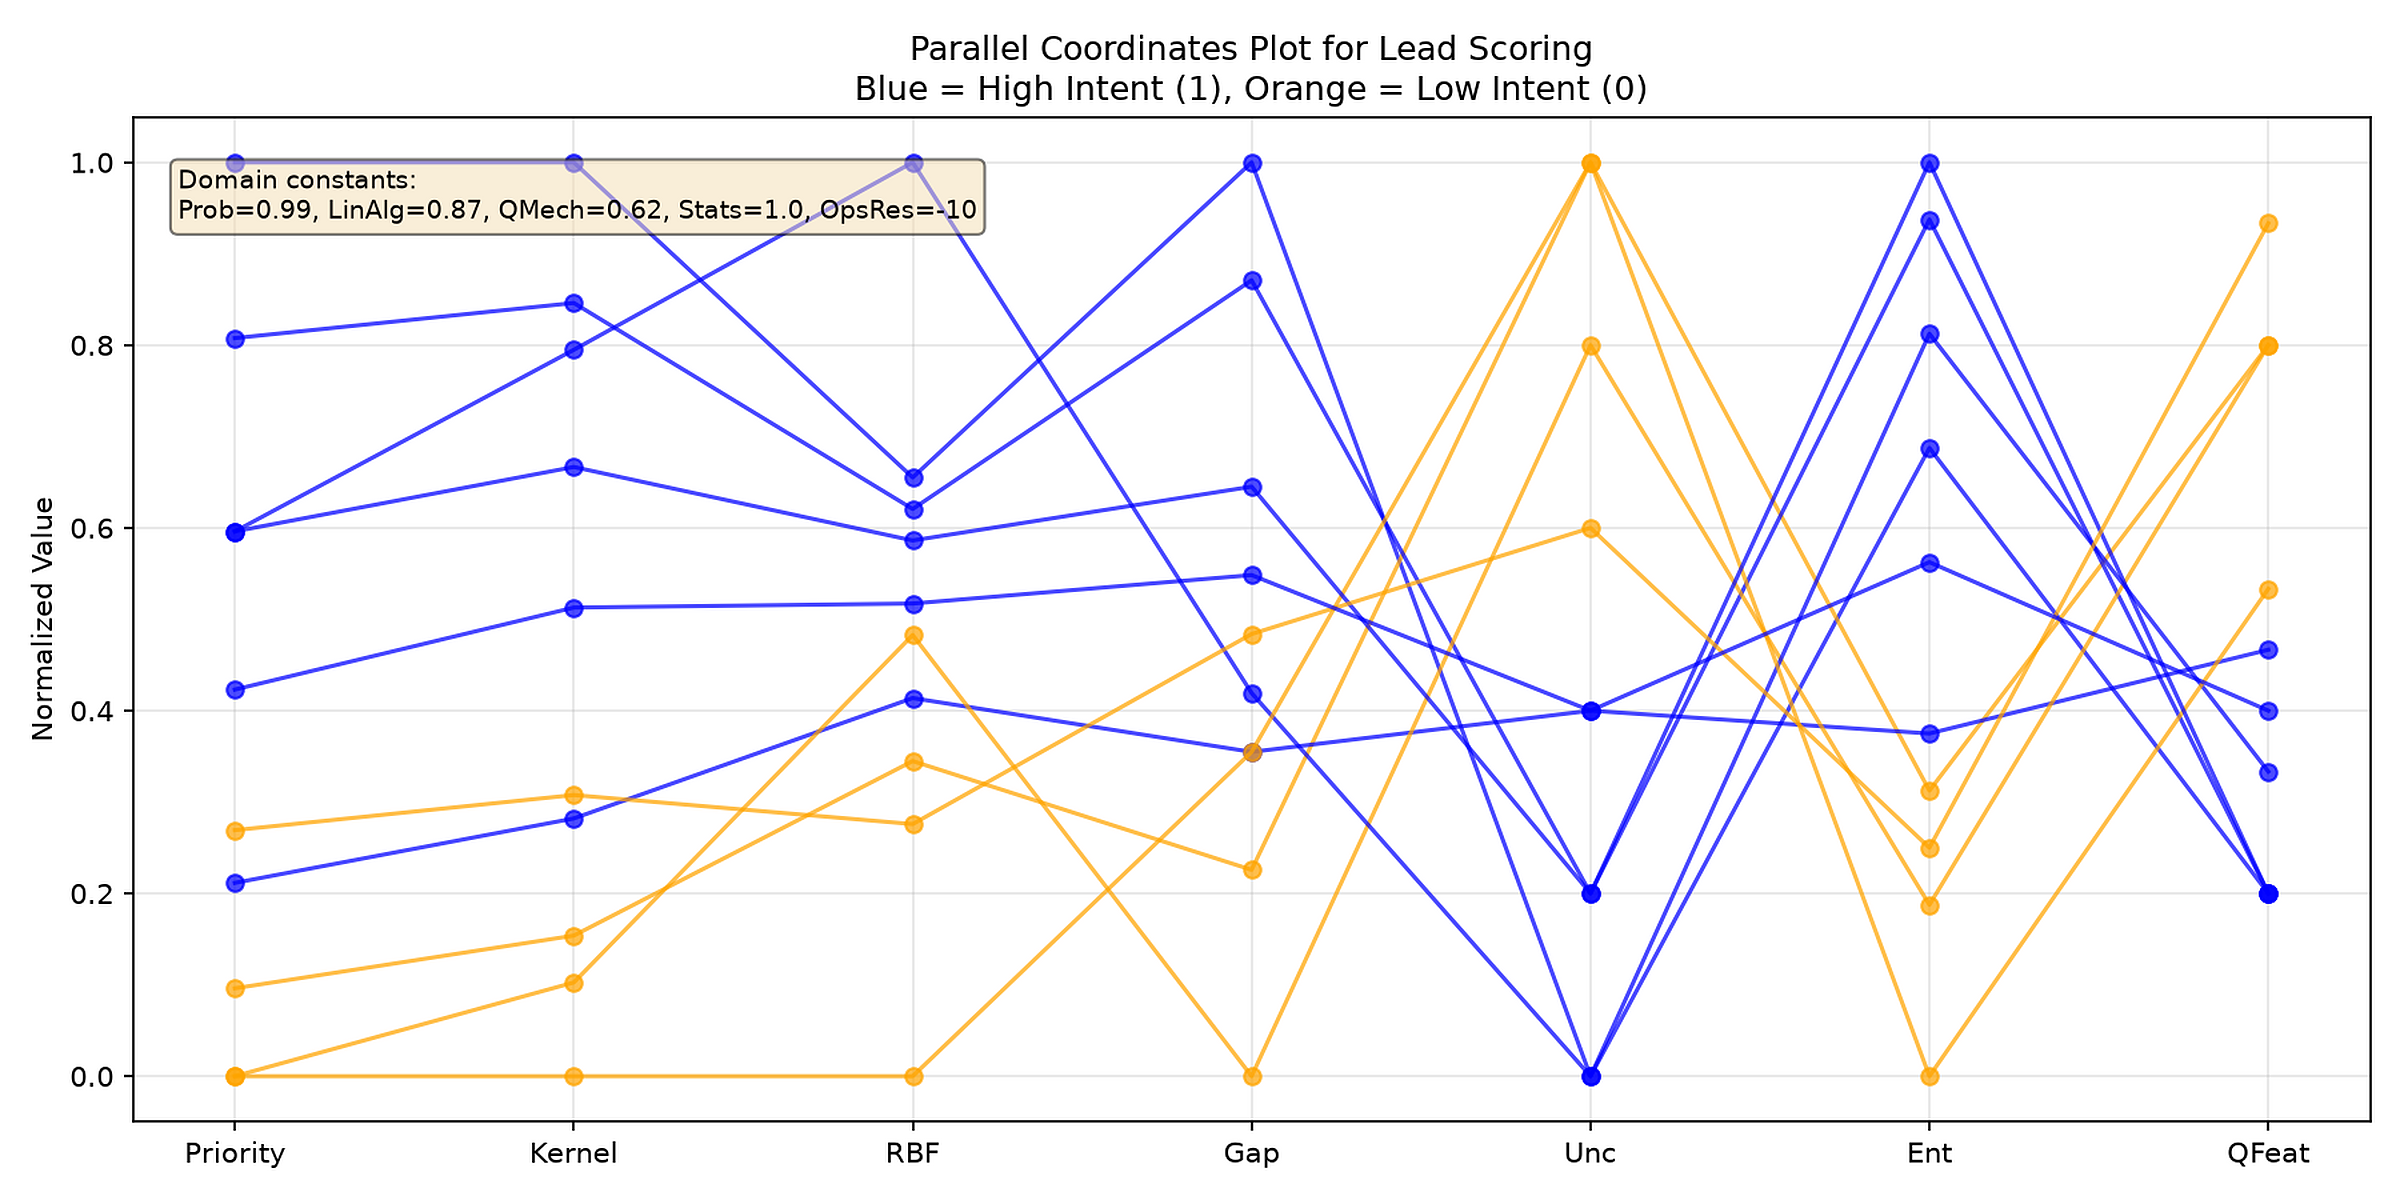
Parallel coordinates plot of lead attributes
Figure 5. Parallel-coordinates view of multi-dimensional lead attributes — interactive exploration via quantiq_client.py.
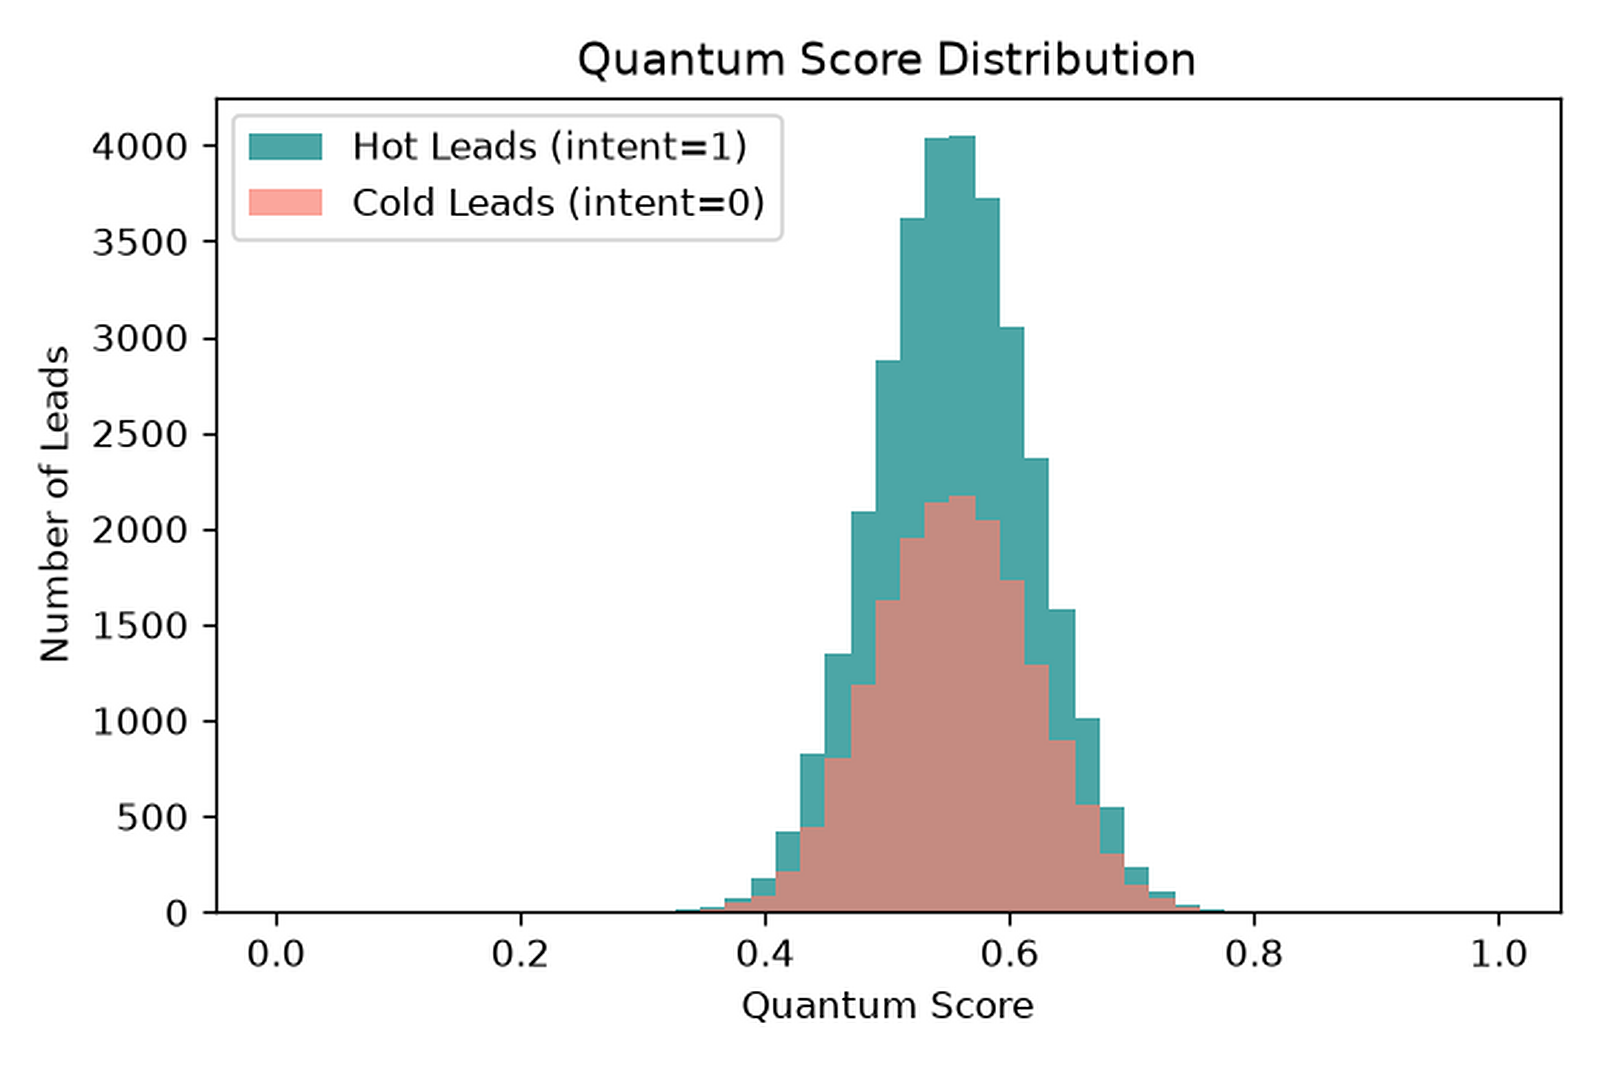
Distribution of QSVM lead compatibility scores
Figure 6. Score distribution across 50,000 enriched trade leads — long-tail high-intent candidates identified for sales assignment.
Animated live scoring leaderboard from QuantIQ API
Figure 7. Live scoring leaderboard animation — API-served lead ranking with real-time graph updates on Hetzner VPS infrastructure.
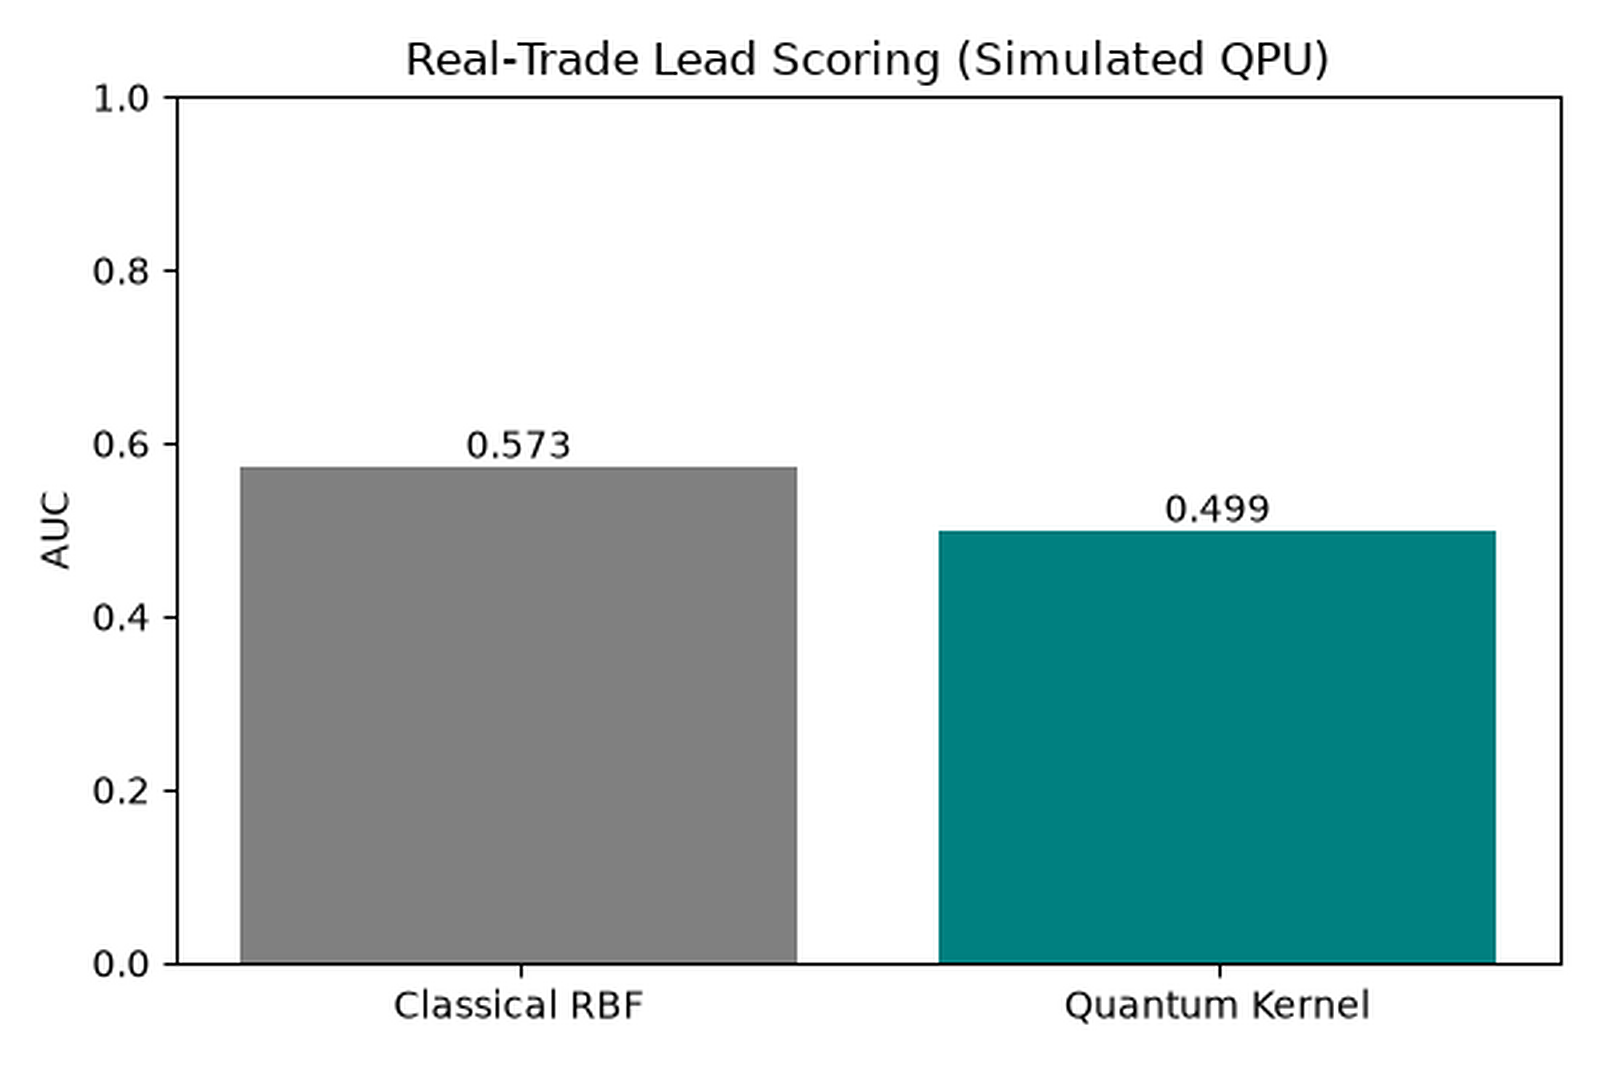
Real trade data QSVM AUC on ibm_marrakesh hardware
Figure 8. Real-trade QSVM evaluation — kernel fidelity 0.6236 on ibm_marrakesh (156 qubits), demonstrating end-to-end quantum-classical hybrid deployment.

Full paper, pipeline & data

Open access · QuantIQ Research Initiative · Kryptur OU · doi:10.5281/zenodo.20765960

Research Paper

Tools + Code