The future of space-based solar power scheduling is now

Beam-IQ · SBSP Beam Scheduling Platform

Download paper

Kryptur Research presents quantum-optimised microwave beam scheduling for space-based solar power — tiered classical greedy and Qiskit QAOA solvers, ERA5 weather validation at 40 global rectennas, and a seven-panel operational dashboard with browser companion frontend.

Solver tiers
4
Classical greedy · QAOA sim · QPU upgrade paths
ERA5 validation cities
40
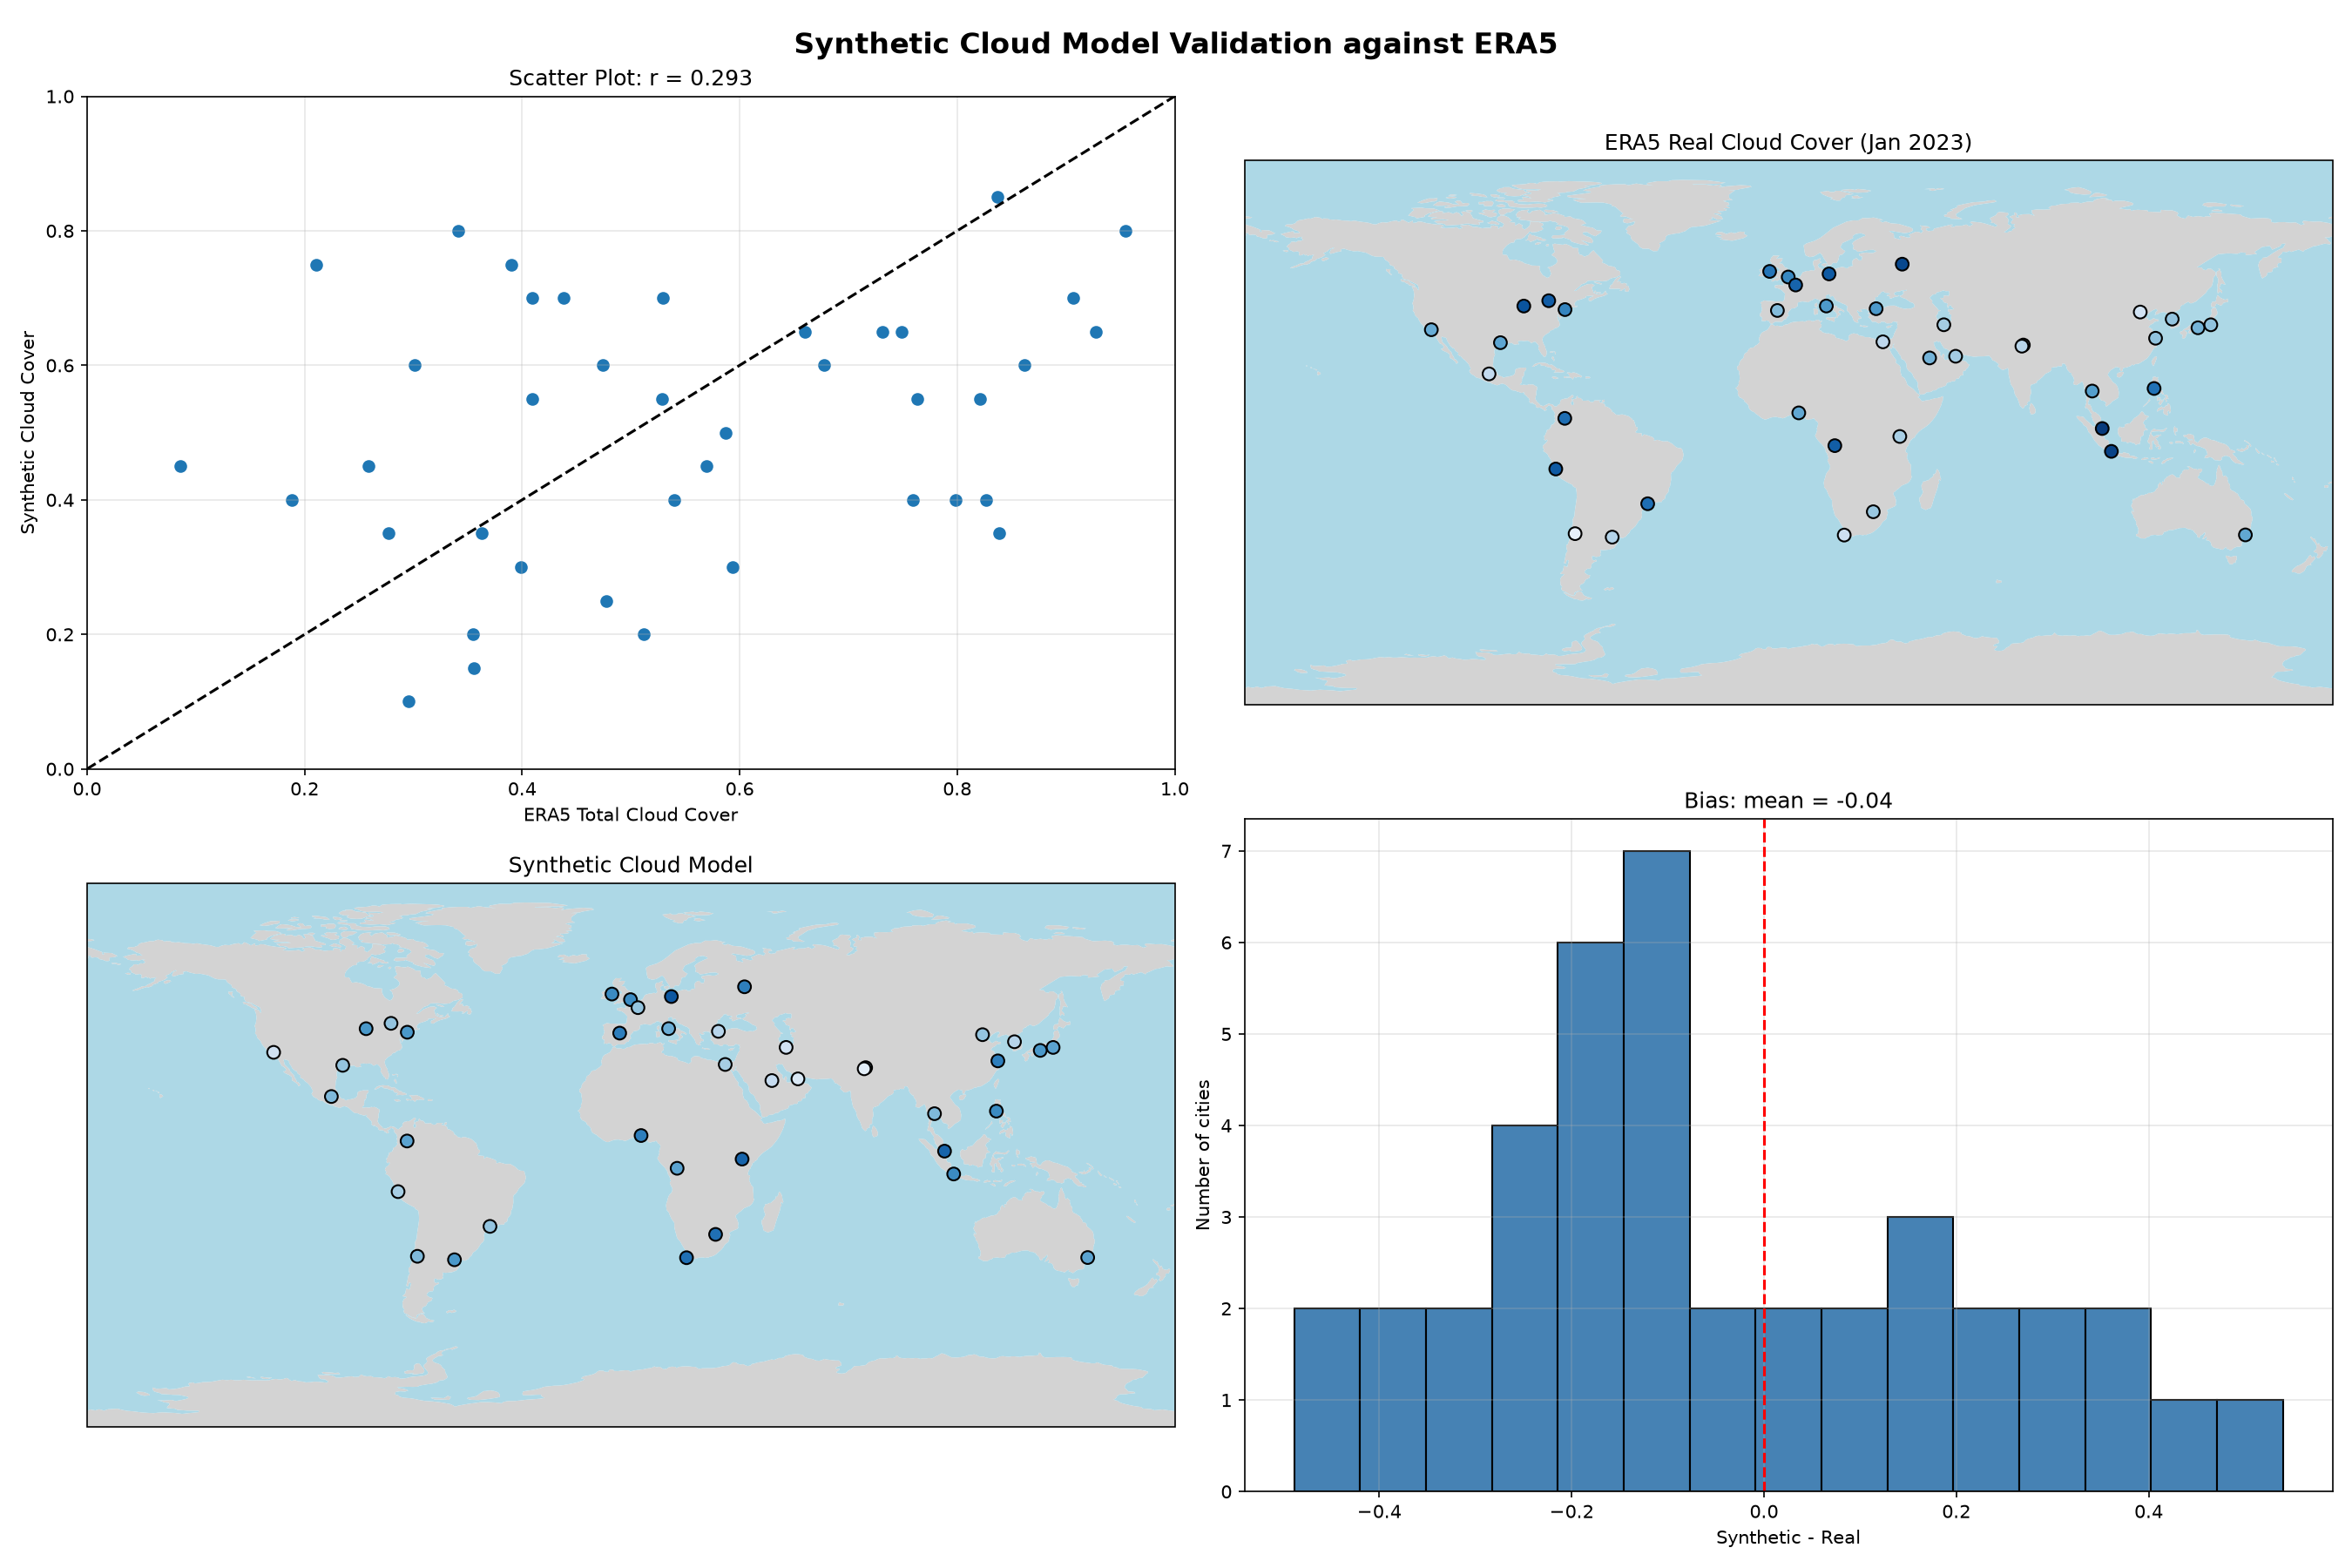
Synthetic cloud model vs Copernicus reanalysis
Operational dashboard
7
Panels replacing two-panel chart — mission KPI block
Forecast horizon
24 h
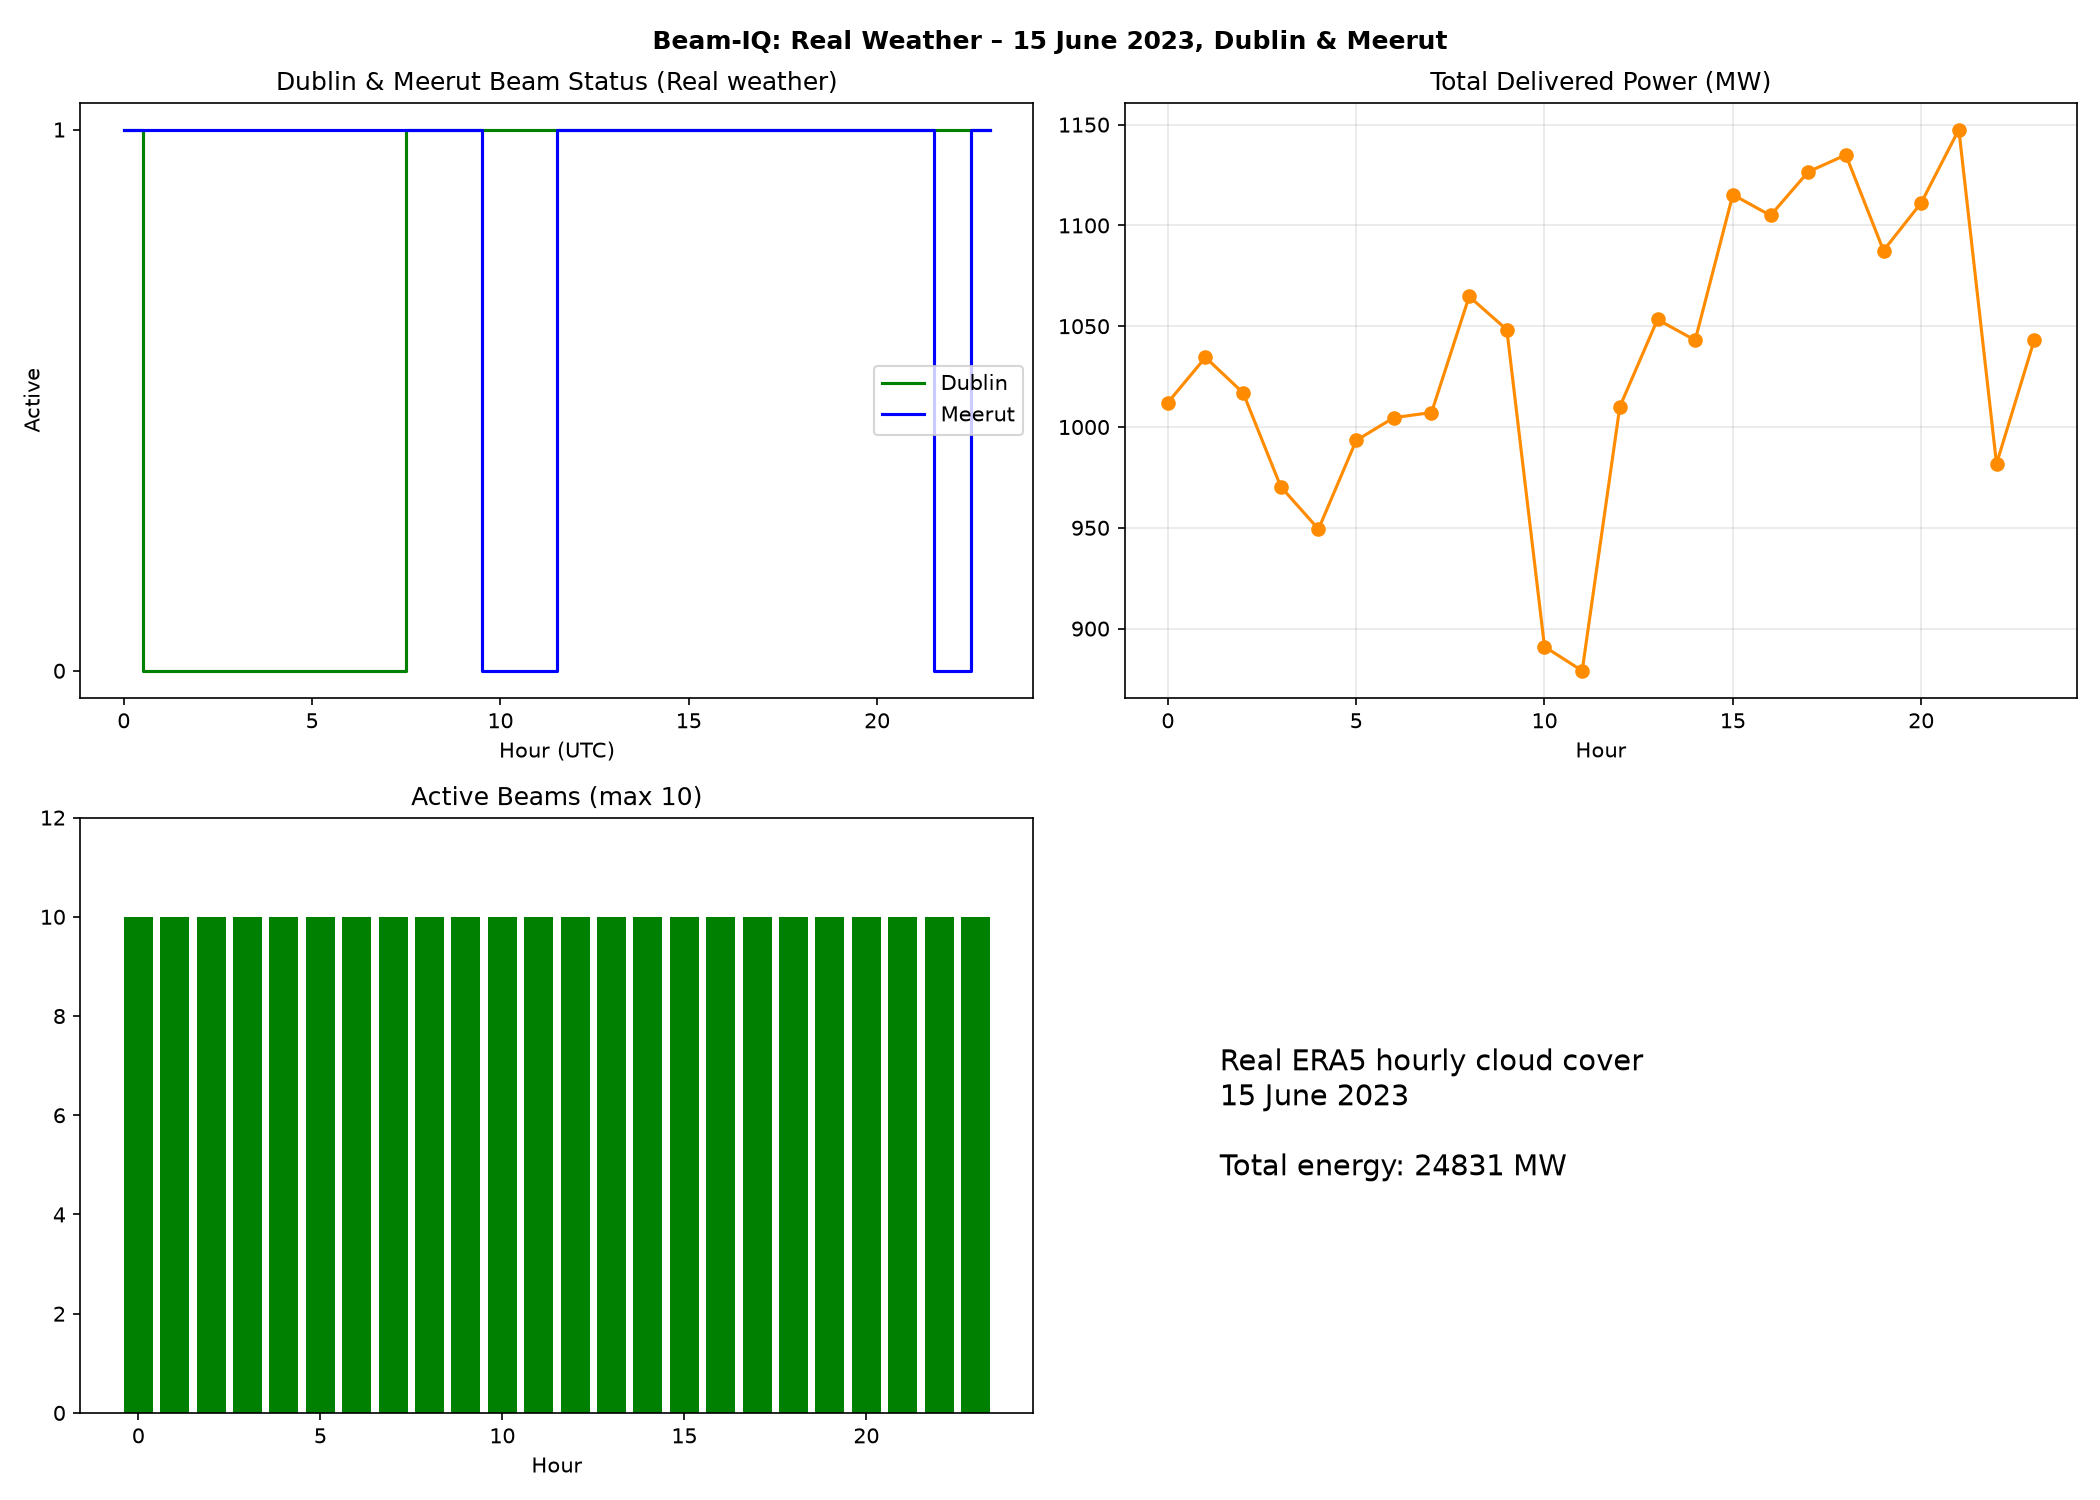
Real hourly ERA5 cloud cover · Dublin & Meerut case study

Recent news

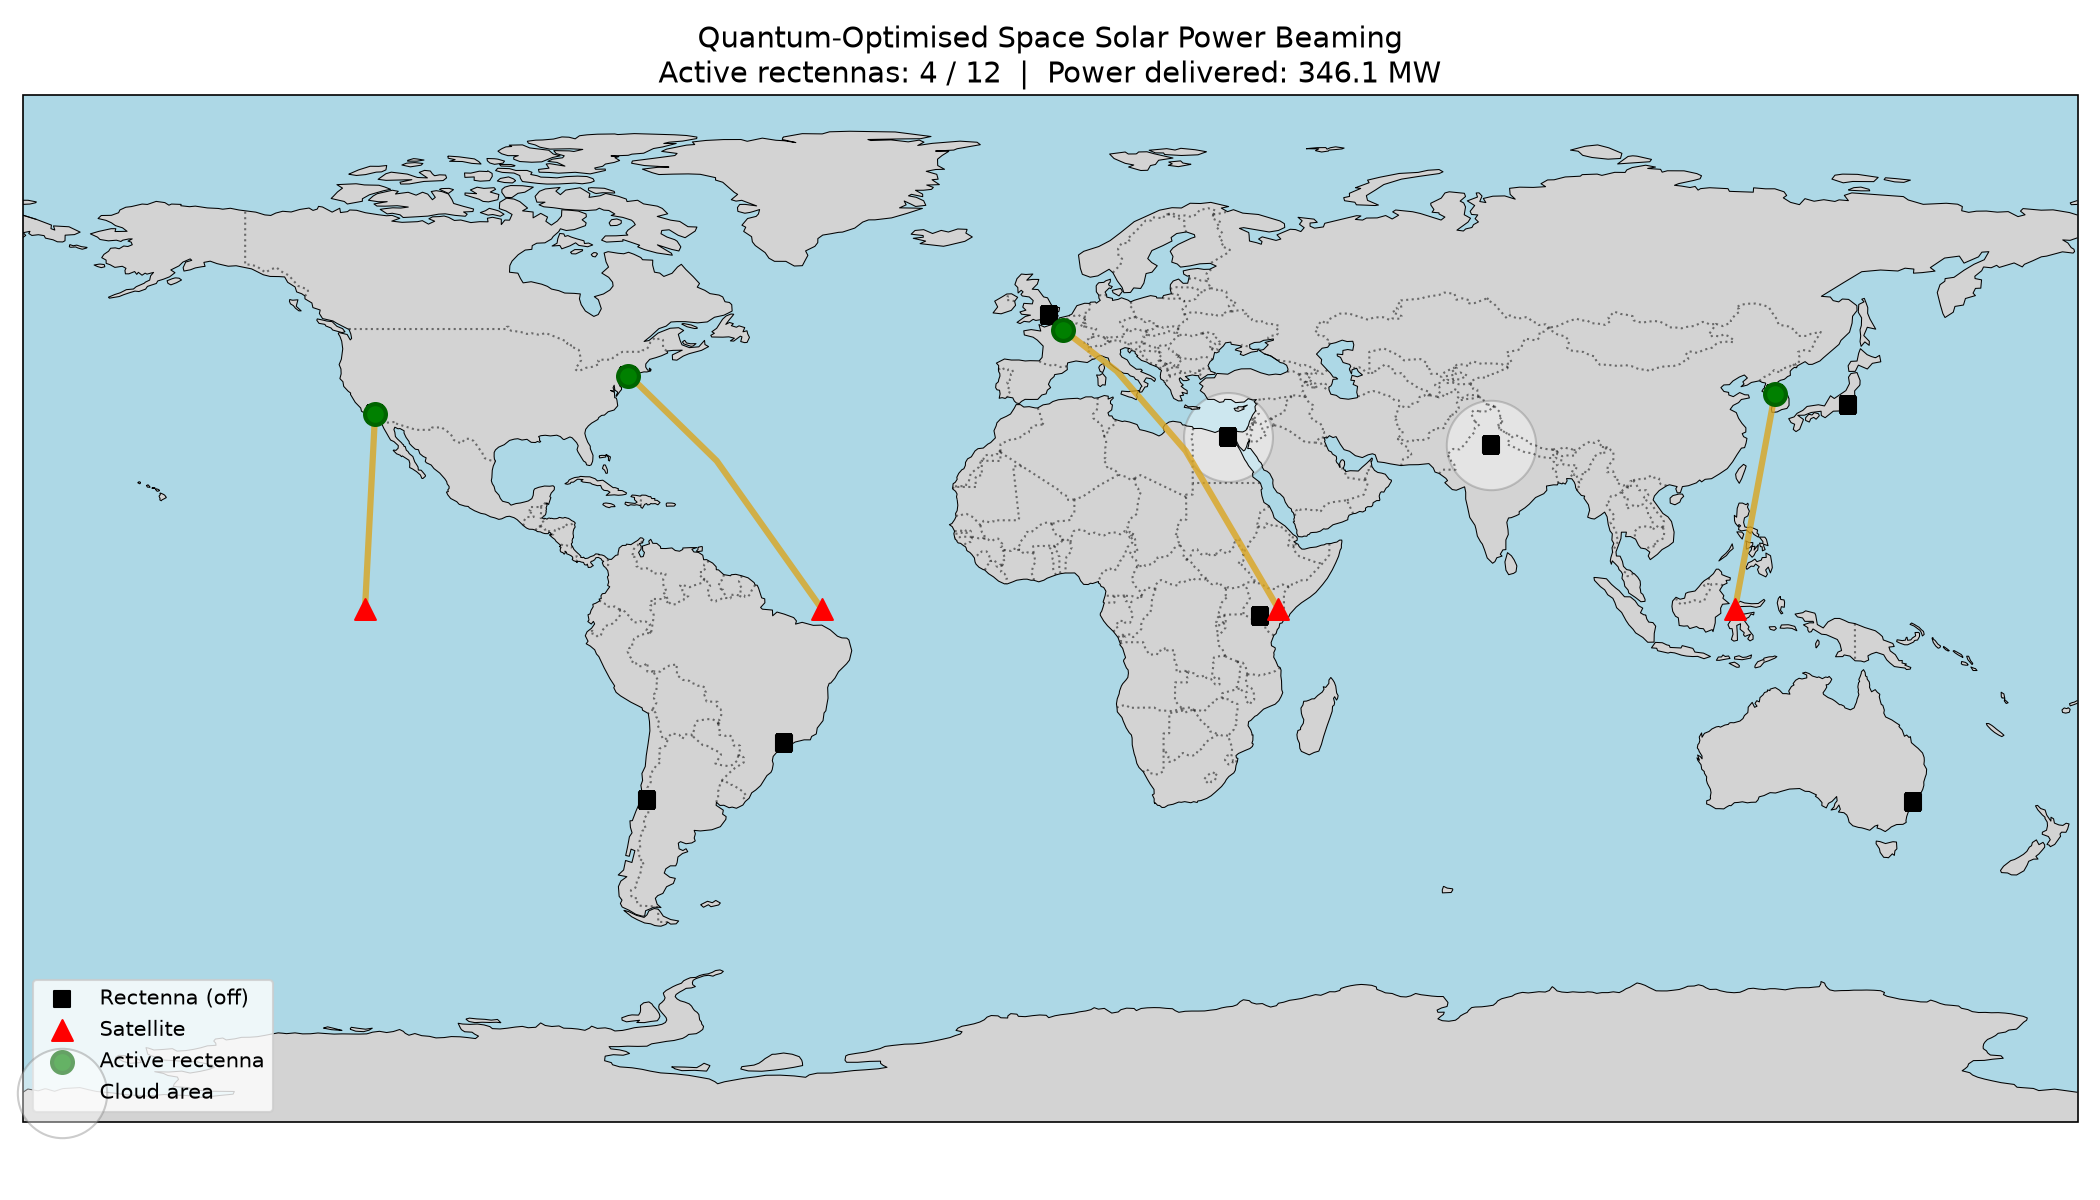
Global rectenna beam assignment world map

Figure 1
Active rectenna assignments across orbital constellation
MWISRectenna

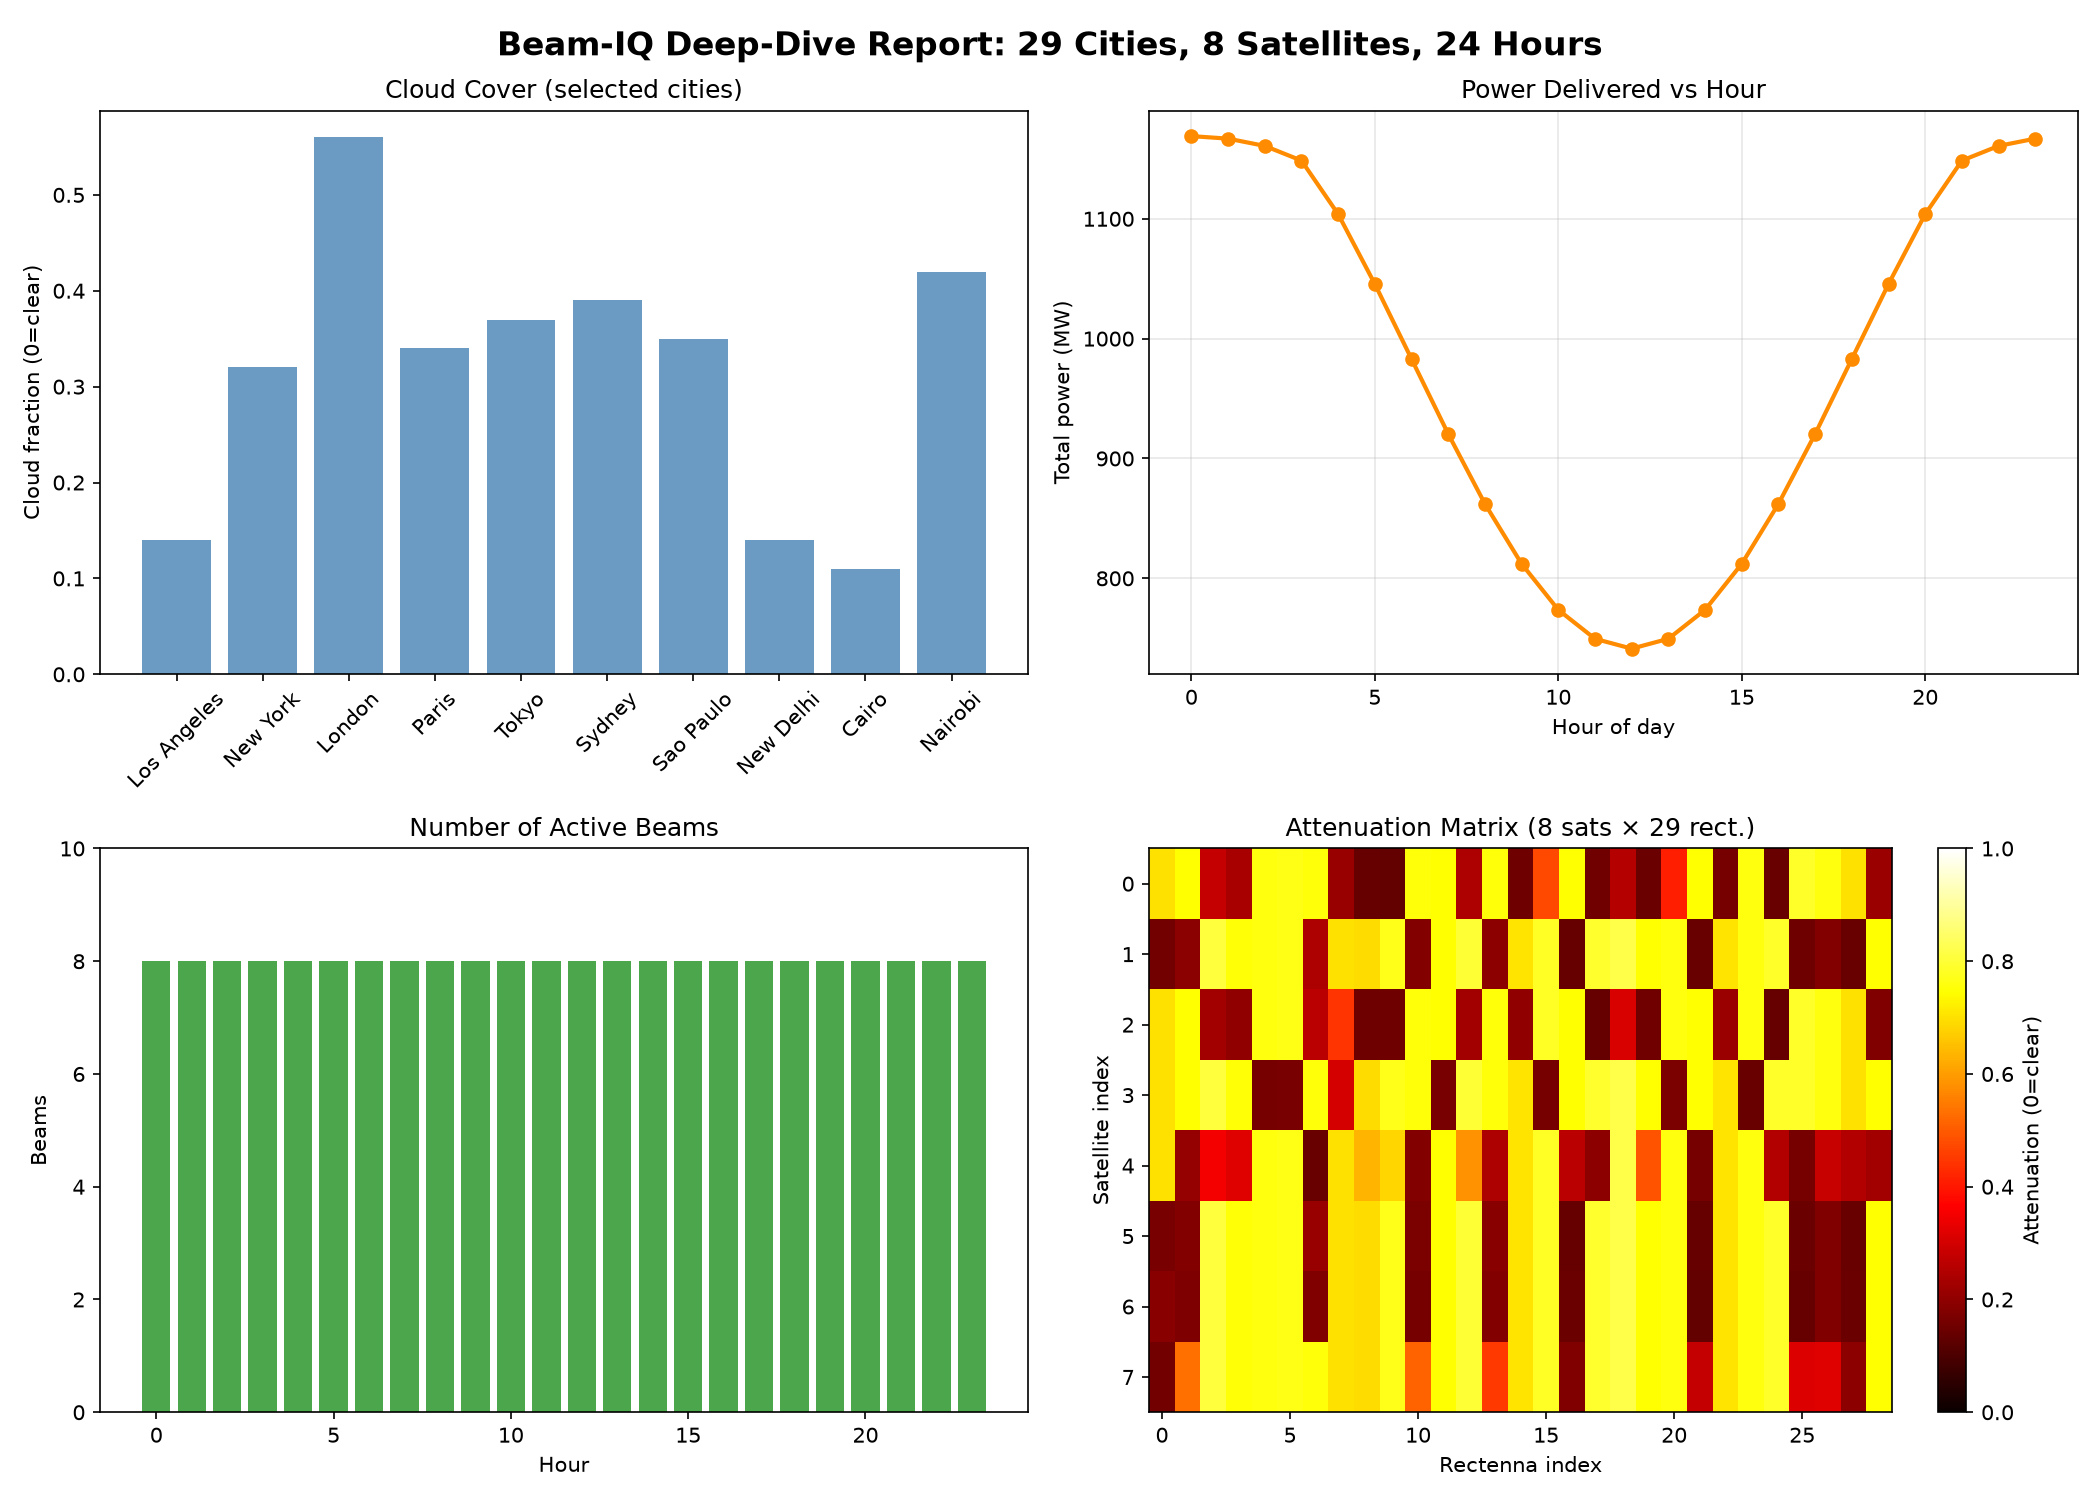
Seven-panel operational dashboard with mission summary

Dashboard
Power · coverage · revenue · cloud · satellite load · utilisation
OperationsKPI
Open access archive on ZenodoRead more research on our hub

Stay up to date

with the latest from

Kryptur Research on

LinkedIn

Results & figures

Table 1. Solver tiers and gating logic enforced by the terminal client
TierConditionSolver mode
1Fewer than 25 rectennasclassical (greedy)
225–30 rectennas, valid client codequantum_sim (Qiskit QAOA)
3>30 rectennas, satellites ≤ ⌊N/2⌋Requires quantum-hardware QPU access
4>30 rectennas, satellites > ⌊N/2⌋Requires quantum-hardware QPU access
Table 2. Seven chart panels and the operational question each answers
PanelQuestion answered
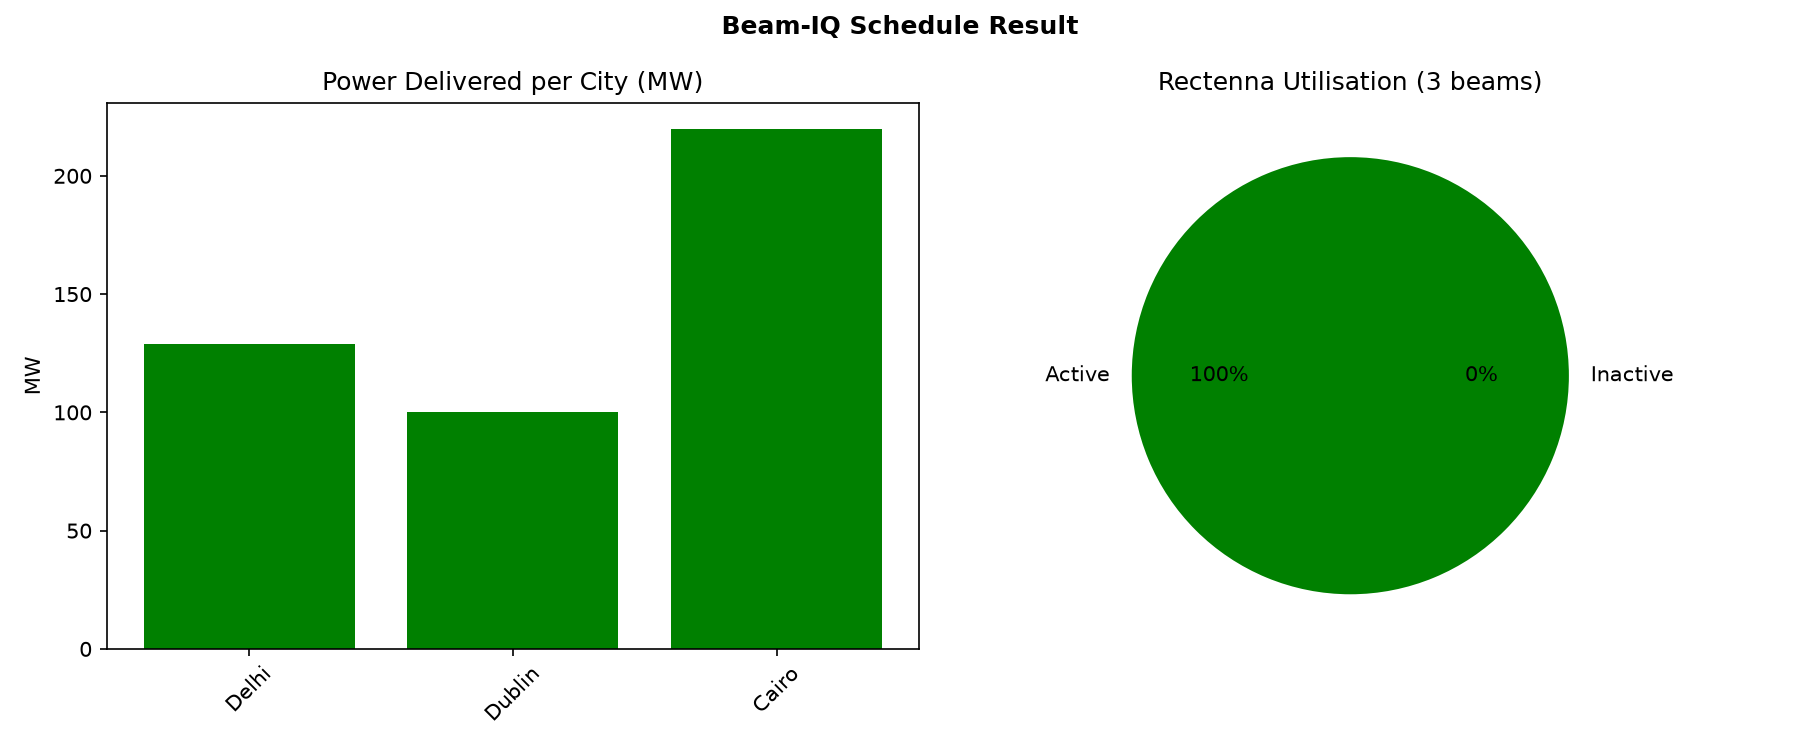
1. Power delivered per cityWhere is power landing right now?
2. Demand vs. effective powerHow large is the per-rectenna delivery gap?
3. Coverage of demand (%)Which rectennas are well-served versus at risk?
4. Revenue per hour by cityWhich rectennas drive commercial return?
5. Cloud cover by cityHow much of the pattern is weather-driven?
6. Satellite load distributionIs load balanced across satellites?
7. Rectenna utilisationWhat fraction of rectennas are actively served?
Quantum-optimised beam world map showing active rectenna assignments
Figure 1. Quantum-optimised beam world map showing active rectenna assignments across a global constellation — maximum-weight independent set encodes beam exclusion constraints.
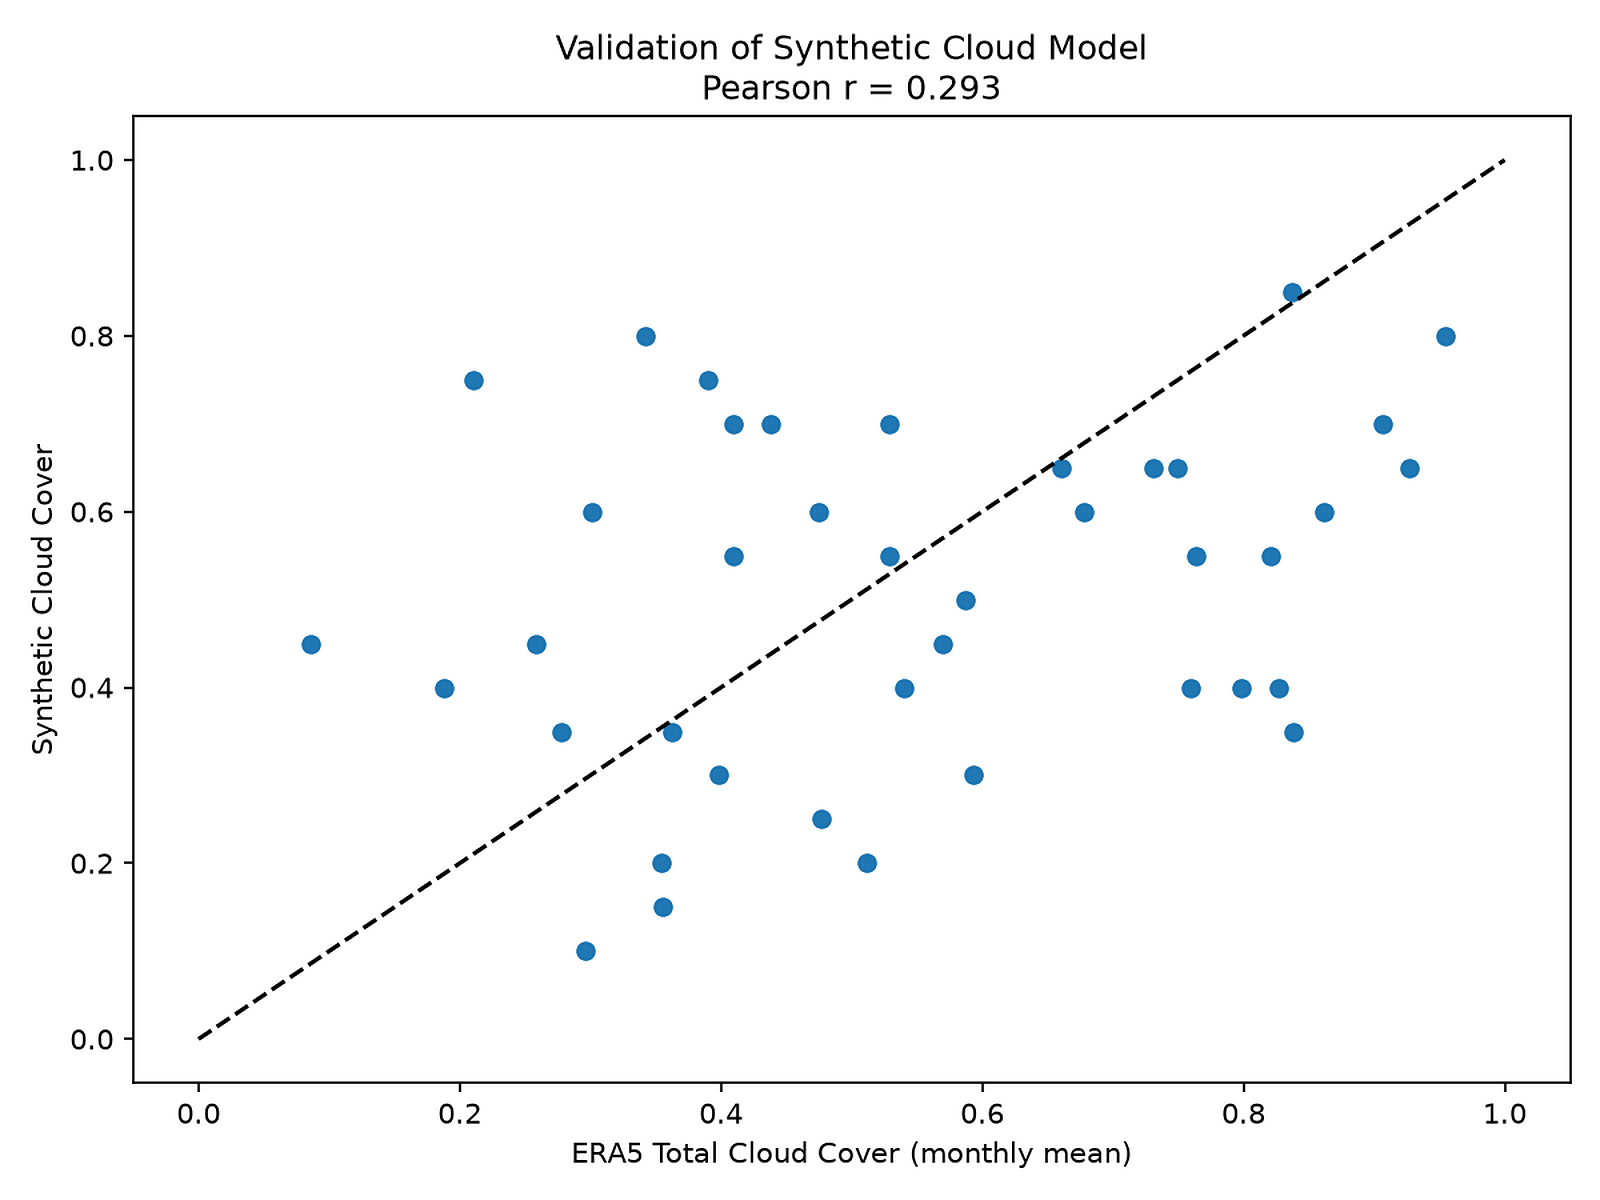
Synthetic cloud model validation against ERA5 at 40 rectenna locations
Figure 2. Synthetic cloud model validation against ERA5 total cloud cover at 40 rectenna locations — supporting confidence in weather-driven scheduling inputs.
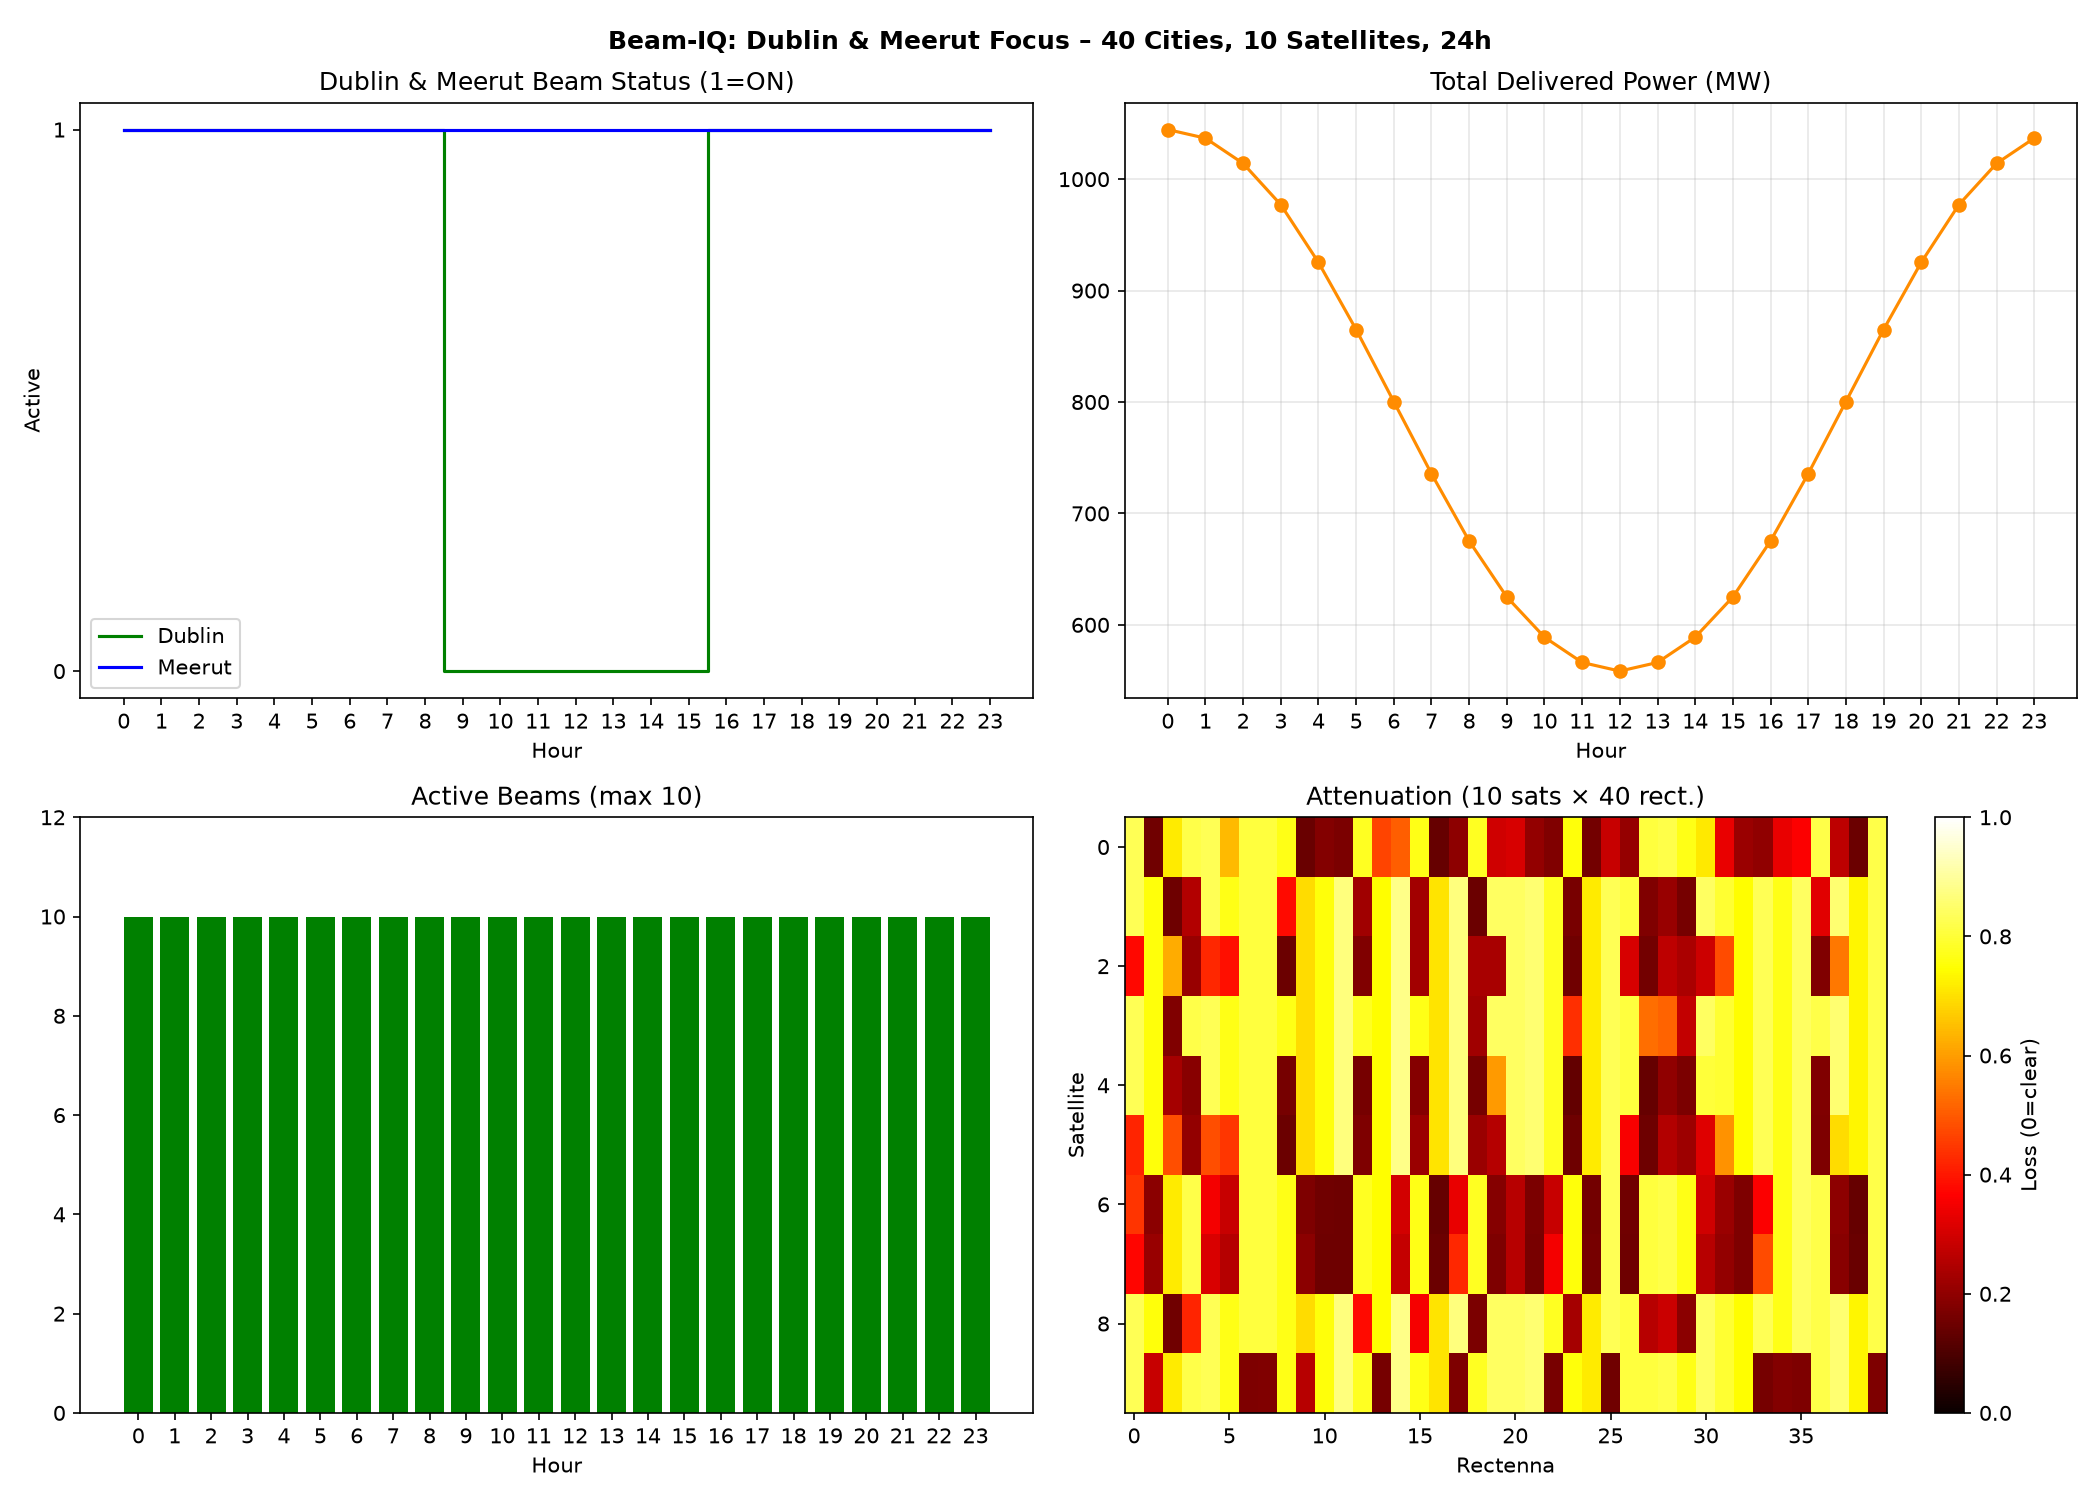
Real-weather 24-hour schedule for Dublin and Meerut using ERA5 hourly cloud cover
Figure 3. Real-weather 24-hour schedule for Dublin and Meerut using ERA5 hourly cloud cover (15 June 2023).
Seven-panel operational dashboard with mission summary KPI block
Figure 4. Seven-panel operational dashboard with mission summary KPI block — power, coverage, revenue, cloud, satellite load, and rectenna utilisation.
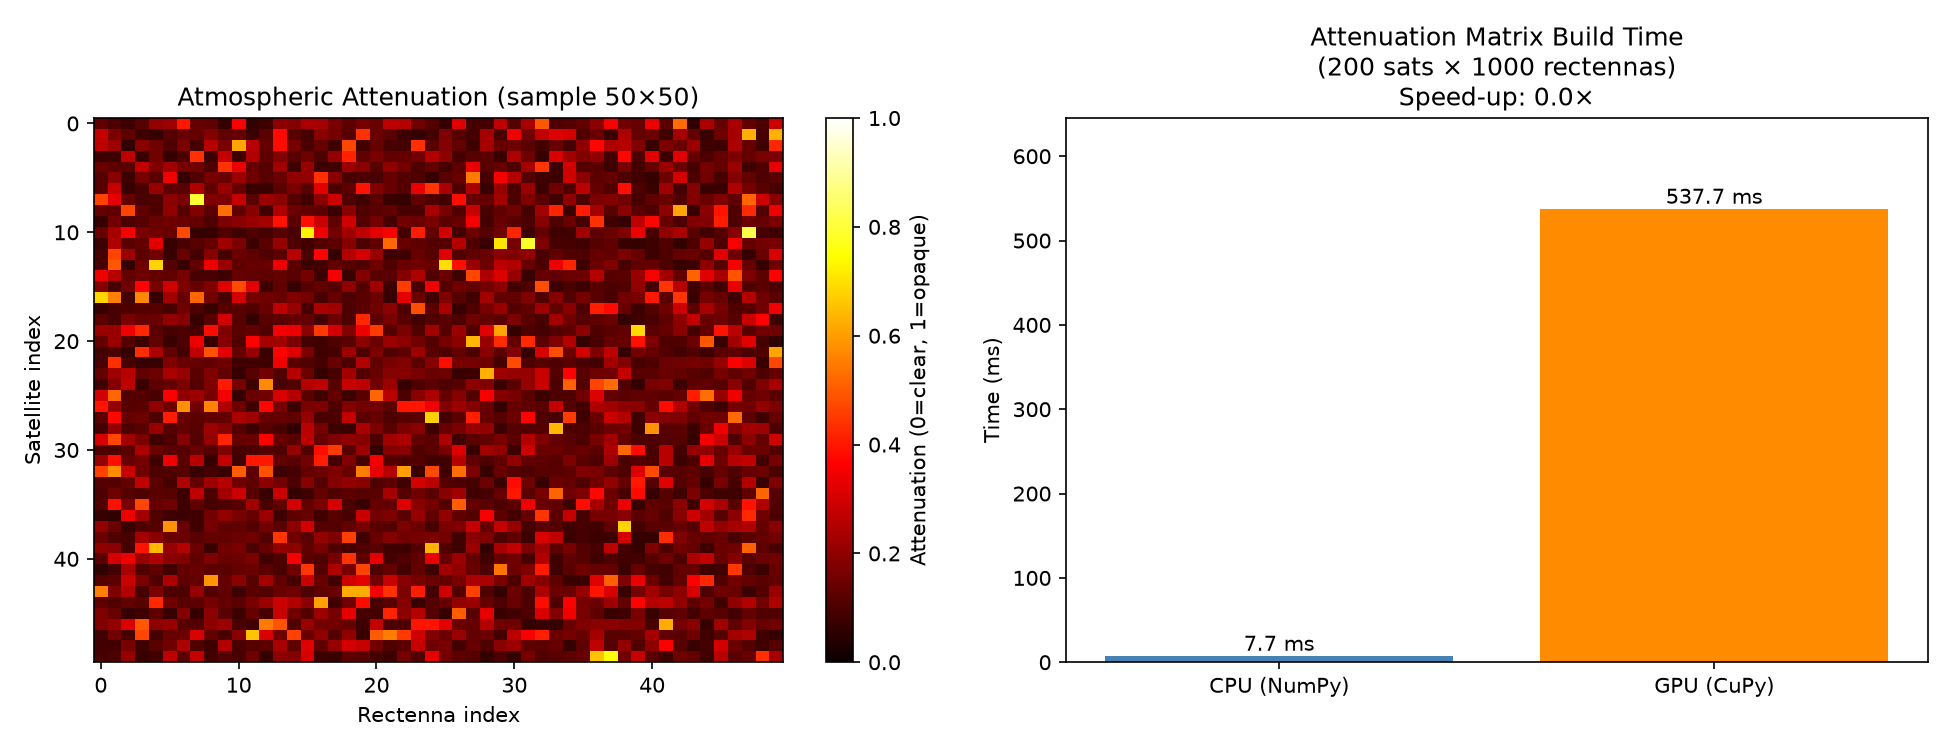
GPU-accelerated attenuation benchmark relative to CPU baseline
Figure 5. GPU-accelerated attenuation benchmark relative to CPU baseline for rectenna-pair matrices — performance expectations for larger constellations.
Beam schedule chart across forecast horizon
Figure 6. Beam schedule chart across the forecast horizon — per-rectenna beam status and satellite assignment over time.
Cloud cover validation scatter plot for scheduling inputs
Figure 7. Cloud cover validation — synthetic estimates compared against ERA5 reanalysis for scheduling input confidence.
Dublin and Meerut rectenna scheduling report
Figure 8. Dublin and Meerut rectenna scheduling report — demand, cloud attenuation, and effective delivered power across the operational window.
Executive summary consolidating four principal Beam-IQ research visuals
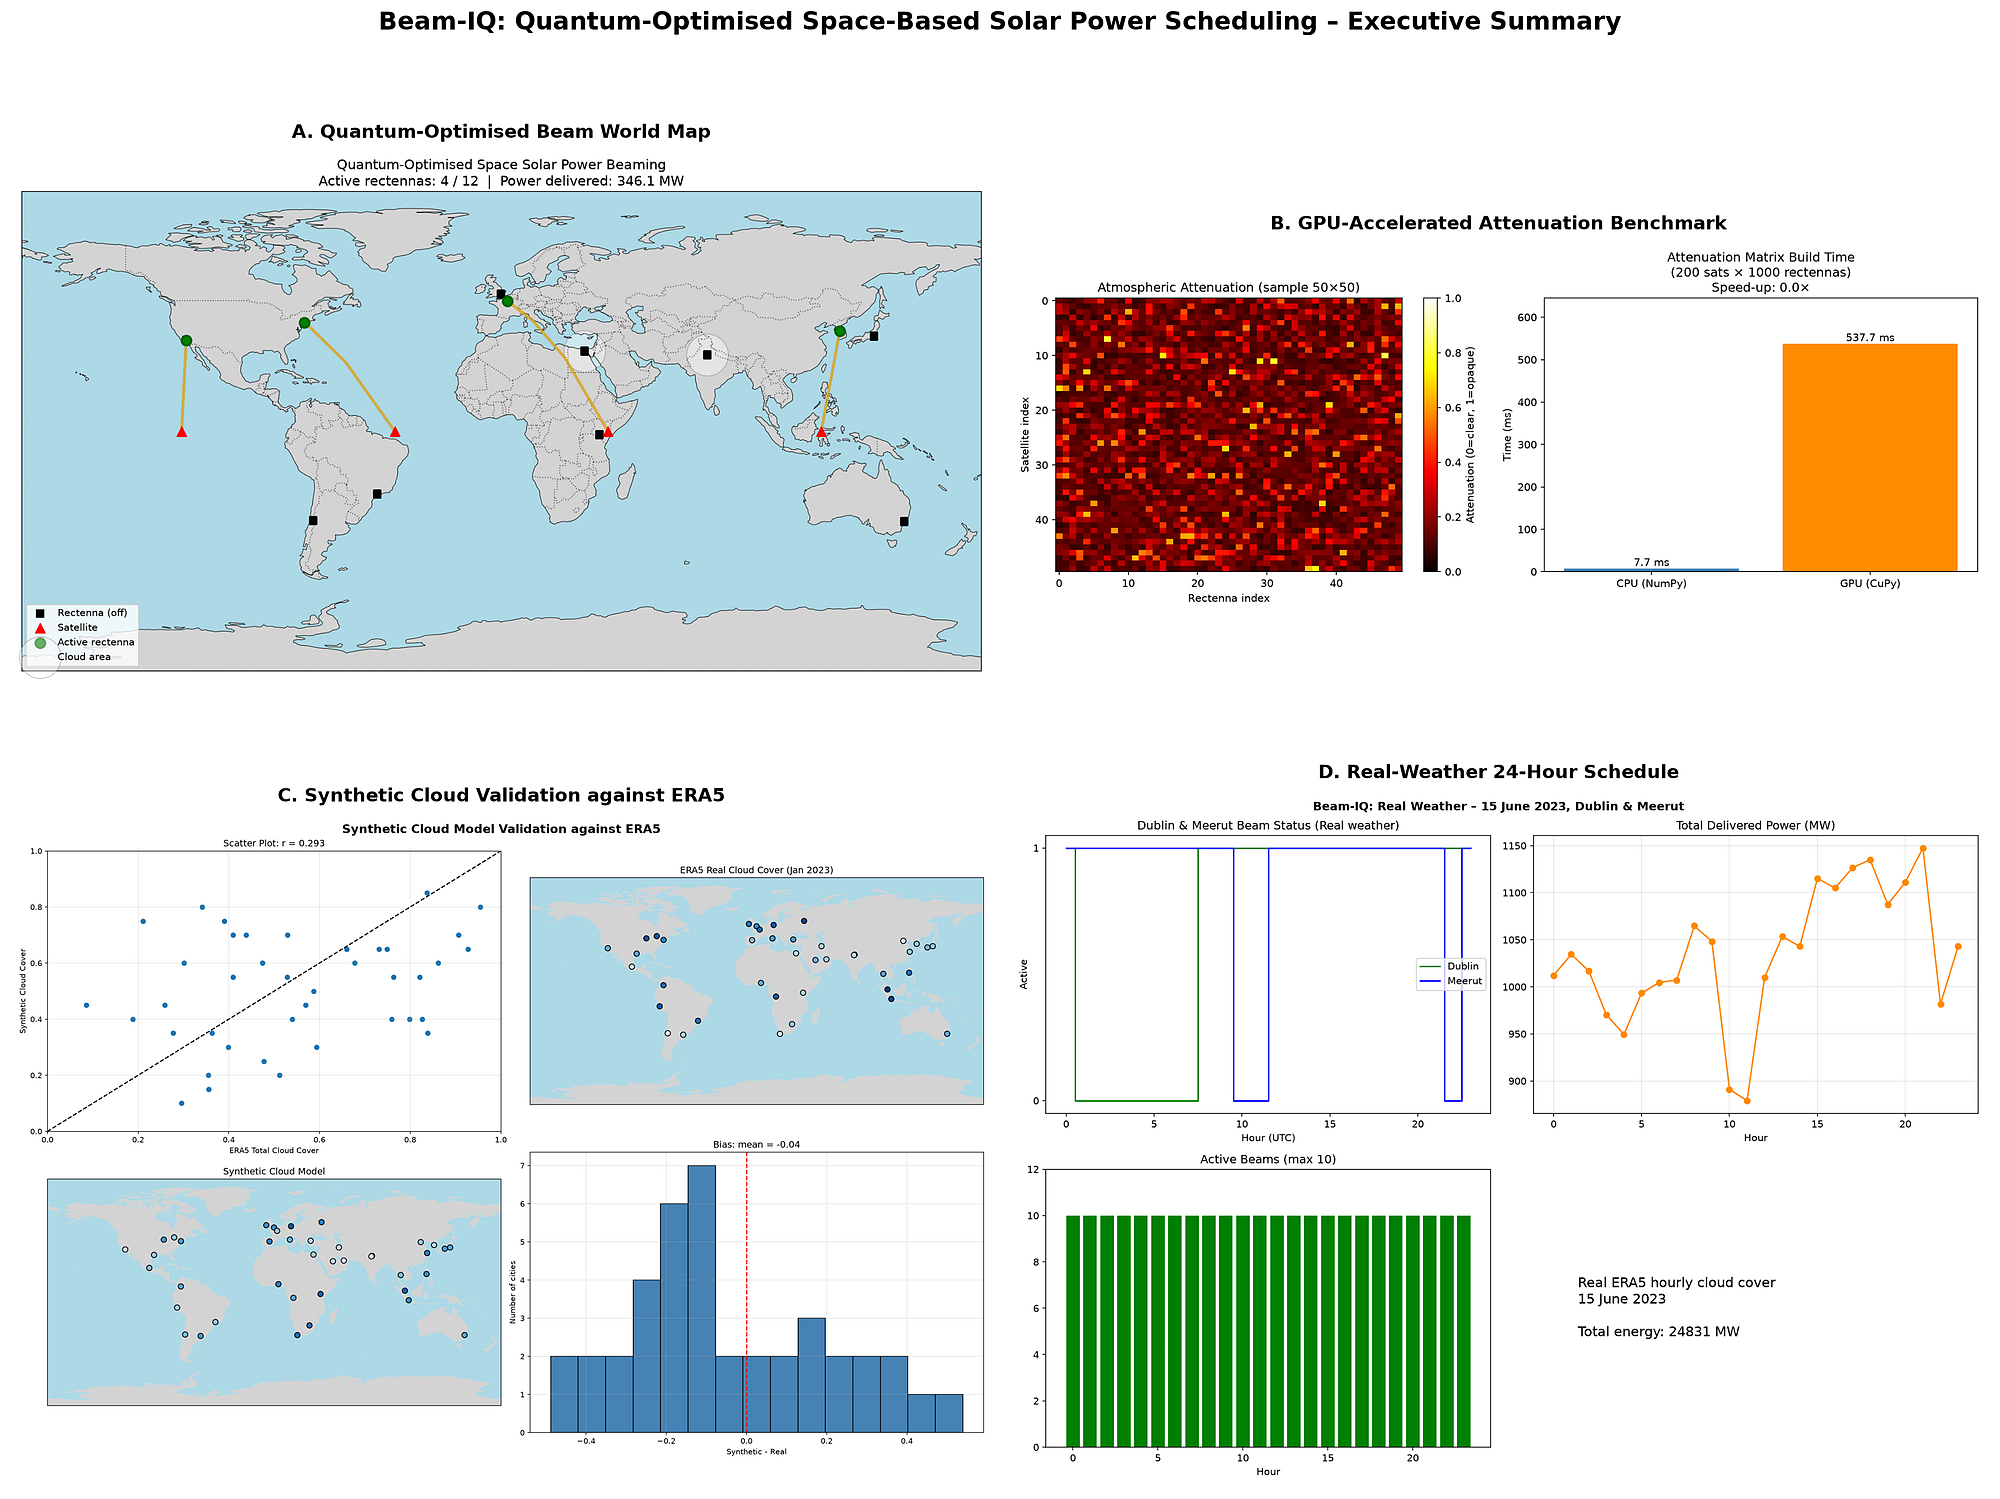
Figure 9. Executive summary consolidating the four principal research visuals — suitable for stakeholder review and investor briefings.

Open access · Beam-IQ Research Initiative

Kryptur OU · doi:10.5281/zenodo.20765960 · Corresponding author Raja Ram M · Zius Quantum R&D Center

Download full report

Tools + Code