The future of self-service data engineering is now

RetailX · ELT Pipeline Platform

Download paper

Kryptur Research presents RetailX — a fully operational, end-to-end data-engineering platform that transforms raw business data into certified analytics through a zero-install terminal wizard and secure REST API. Kafka streaming, DuckDB lakehouse, dbt transformations, and Airflow orchestration on a single commodity VPS — with multi-tenant isolation and 25 self-service jobs.

Wizard jobs
25
23 base-tier plus Jobs 24–25 tier-1 analytics deliverables
dbt quality tests
17
Unique · not-null · referential integrity — 100% pass rate
Ingestion paths
4
CSV upload · REST API · CDC stream · visitor tracking pixel
Dashboard panels
13
Chart.js tier-1 live dashboard at /dashboard

Recent news

Tier-1 live analytics dashboard — 13 Chart.js panels

Dashboard
Revenue trend · forecast · visitor pageviews · dbt quality gauge
Job 25Tier-1

Self-contained HTML analytics report (Job 24)

Report
212 KB offline shareable HTML with embedded Chart.js
AnalyticsOffline
Open access archive on ZenodoRead more research on our hub

Stay up to date

with the latest from

Kryptur Research on

LinkedIn

Results & figures

Table 1. Primary ingestion paths and Kafka topics
No.PathKafka topicDescription
1CSV Uploadretail-eventsStructured file upload via /ingest endpoint
2REST API Sourceretail-eventsJob 20 fetches JSON from external endpoints
3CDC Simulationcdc-eventsJob 19 accepts change-event JSON arrays
4Visitor Pixelvisitor-events1×1 transparent GIF pageview tracking
Table 2. dbt star-schema models and their roles
No.ModelPurpose
1stg_retail_eventsStaging view: cast timestamps, compute total_amount, deduplicate
2dim_productProduct dimension with surrogate keys and SCD attributes
3fact_salesSales fact table joining cleaned events with product dimension
Table 3. Live endpoint capture summary (26 June 2026)
MetricValue
Endpoints captured26
JSON artefacts22 files
Chart outputs3 (ML, web analytics, visitor)
Tier-1 artefacts18 files (Jobs 24–25 report, dashboard, HTML)
dbt test resultPASS=17 WARN=0 ERROR=0
Live ML demand forecast for demo_retail client
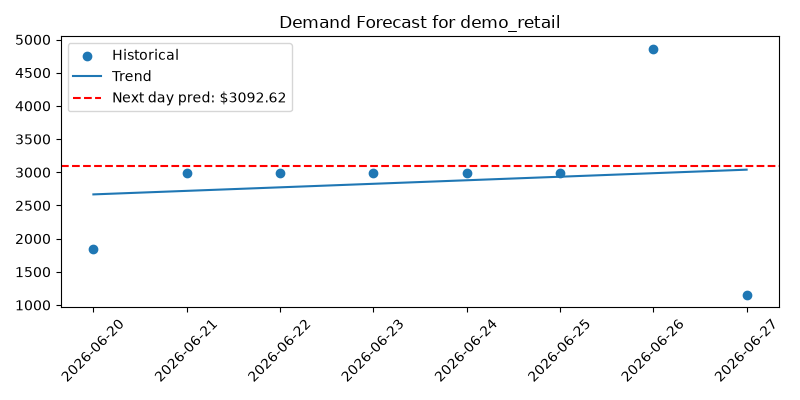
Figure 1. Live ML demand forecast (Job 18) for client demo_retail — historical scatter, trend line, and next-day revenue prediction of $3,092.62.
Live web data analytics chart from JSONPlaceholder public API
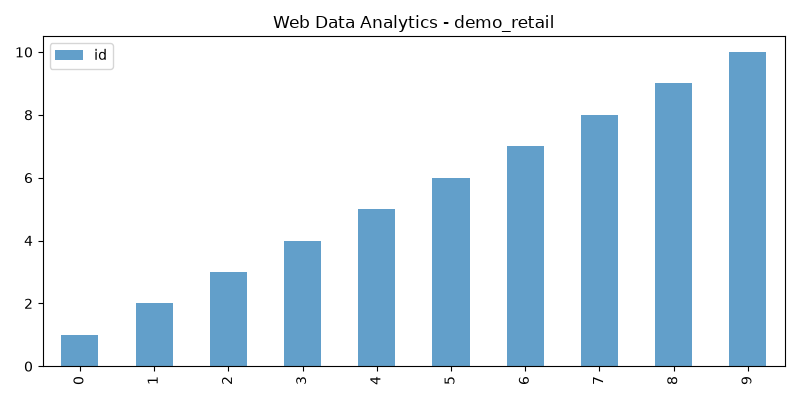
Figure 2. Live web data analytics chart (Job 21) from JSONPlaceholder public API — column statistics and bar chart from fetched user records.
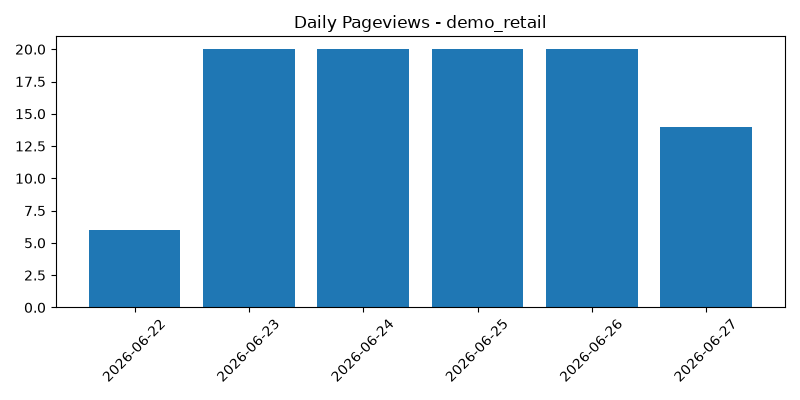
Live daily visitor pageview chart for demo_retail client
Figure 3. Live daily visitor pageview chart (Job 23) for client demo_retail — embedded tracking pixel analytics across top pages.
Tier-1 analytics report summary with KPI panel and revenue charts
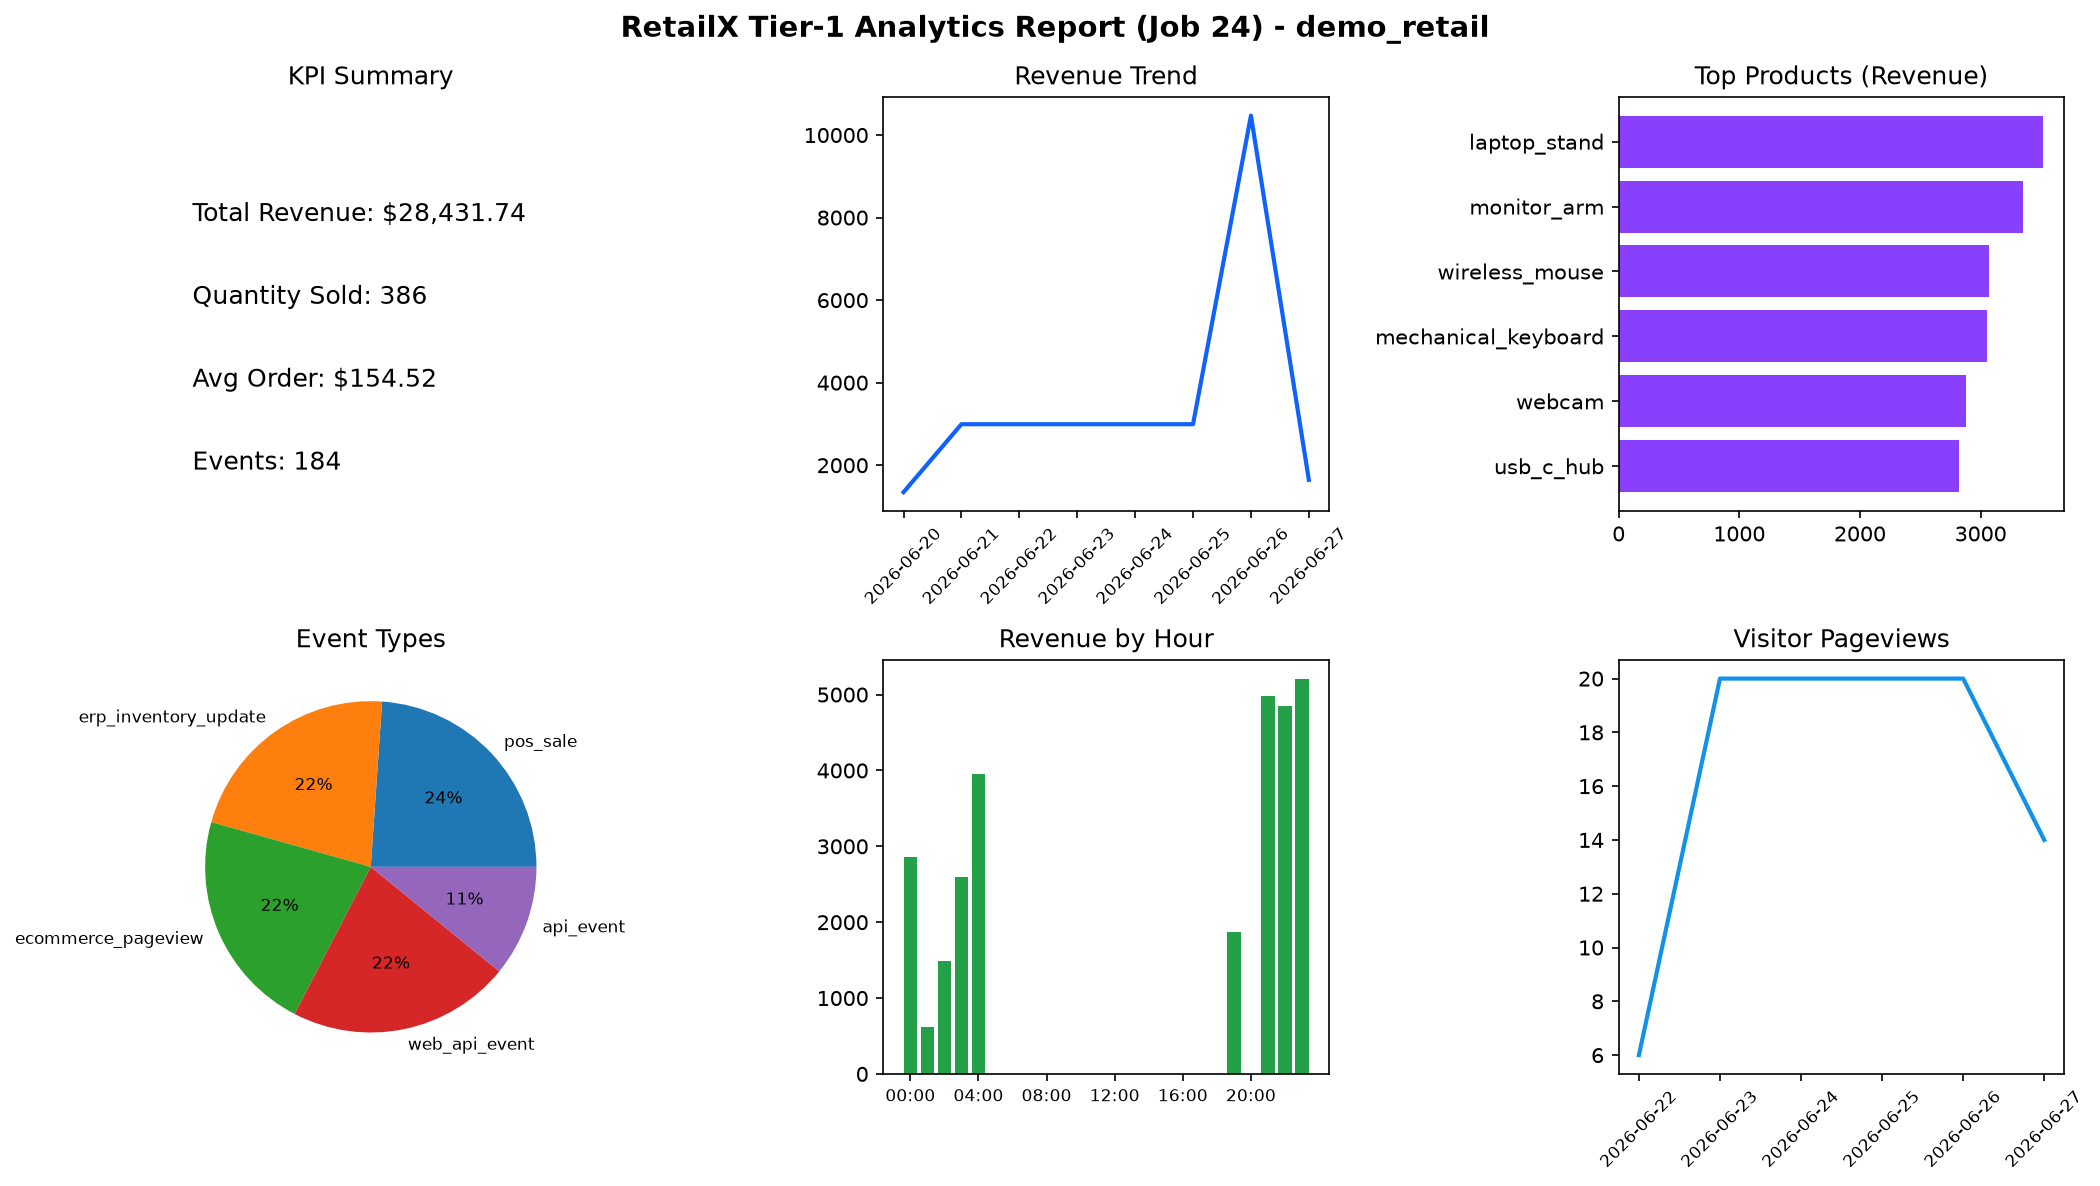
Figure 4. Tier-1 analytics report summary (Job 24): KPI panel, revenue trend, top products, event types, hourly revenue, and visitor pageviews — full HTML report is self-contained and shareable offline.
Tier-1 live dashboard summary with 13 Chart.js panels
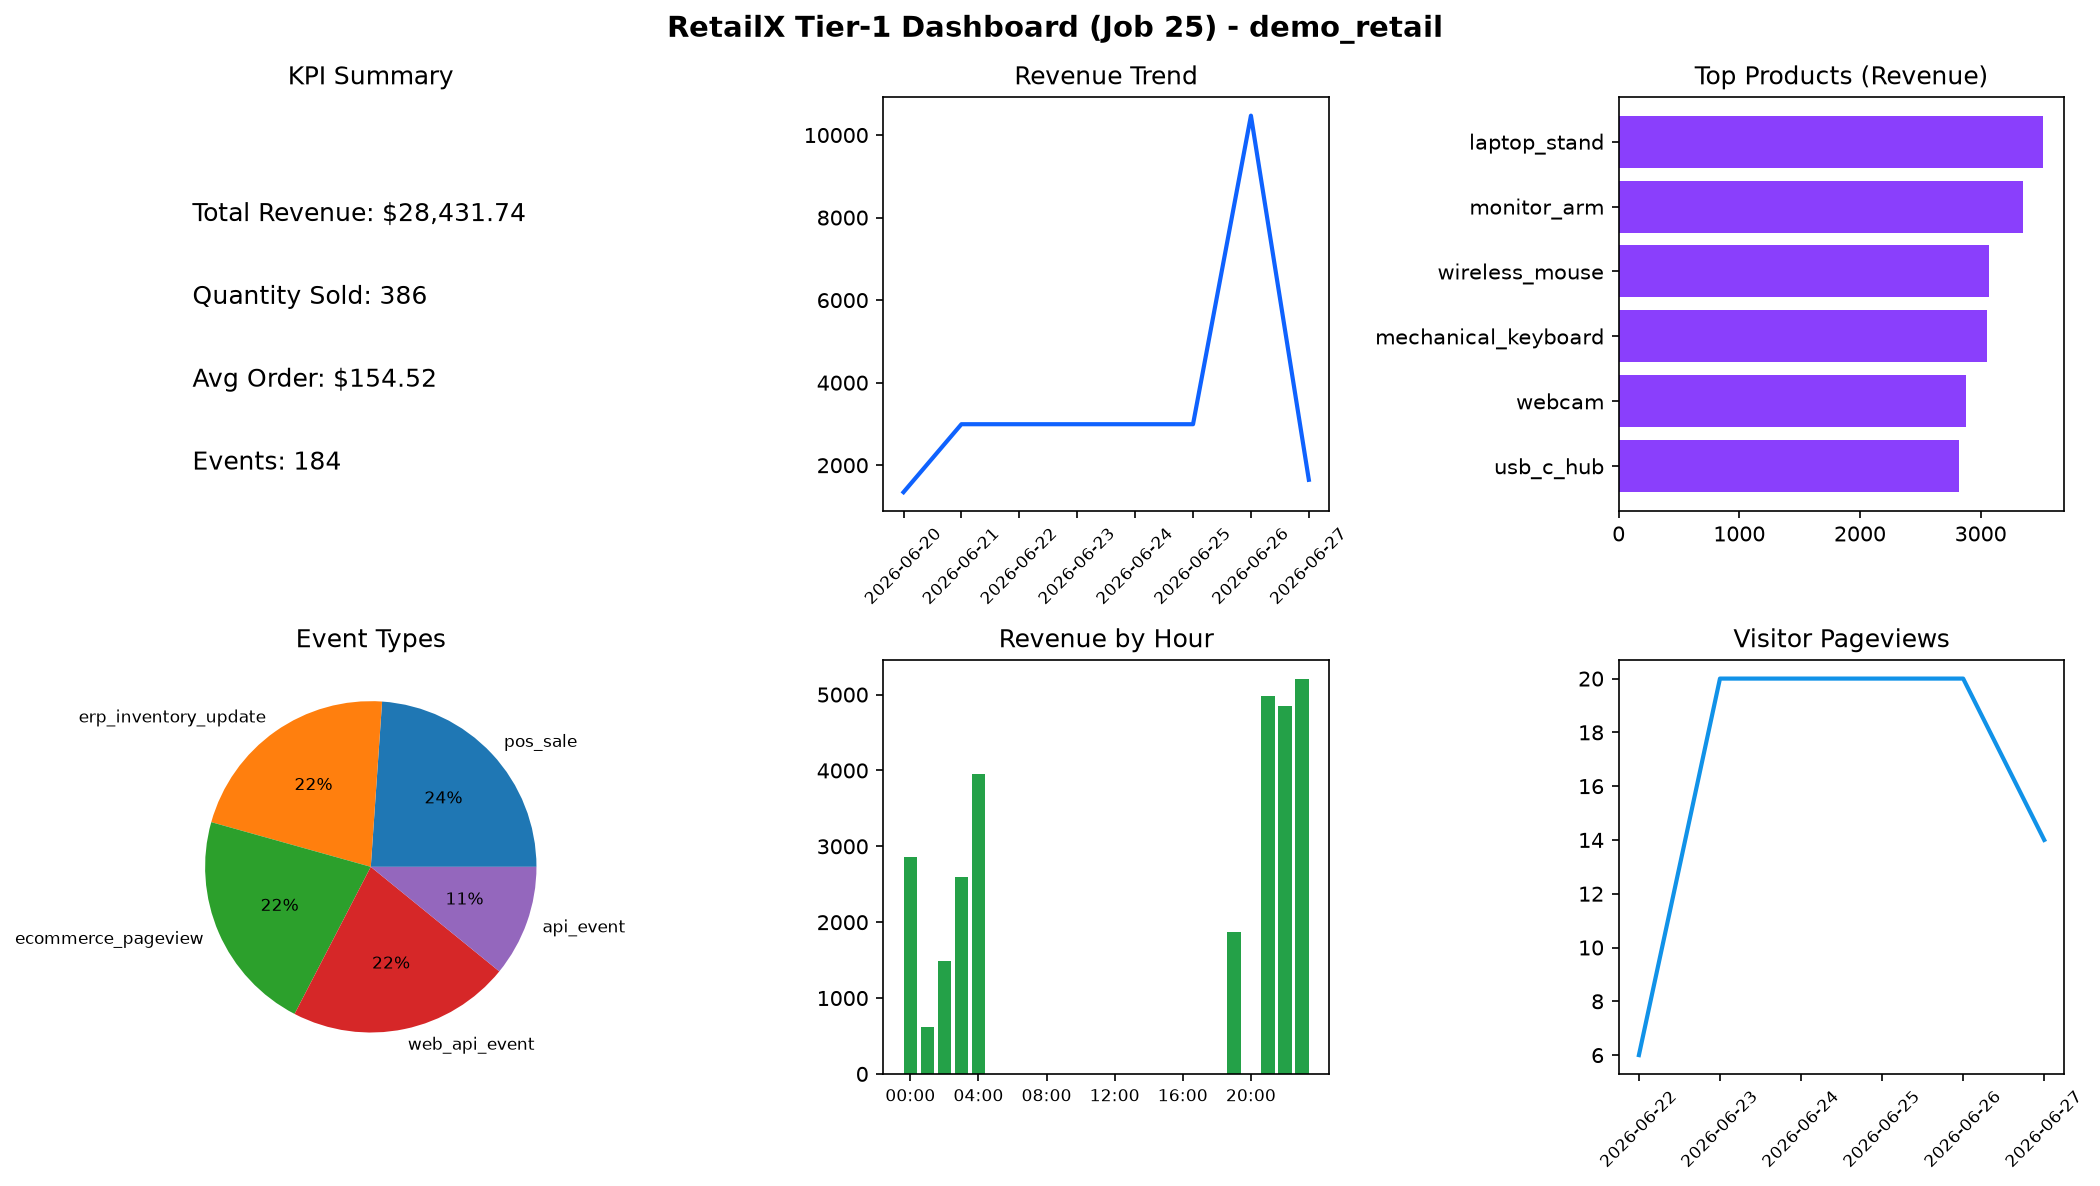
Figure 5. Tier-1 live dashboard summary (Job 25): KPI panel, revenue trend, top products, event types, hourly revenue, and visitor pageviews — full interactive UI served at /dashboard with in-browser API-key authentication.
Table 4. Tier-1 live dashboard KPIs (Job 25, client demo_retail)
MetricLive value
Total revenue$28,431.74
Quantity sold386
Average order value$154.52
Unique products11
Total events184
Data quality (dbt)17/17 tests (100%)
Table 5. Performance benchmark on dedicated VPS deployment
MetricValue
CPU cores16 vCPUs (AMD EPYC)
Memory30 GiB RAM
CPU utilisation (steady state)< 10%
Airflow DAG completion time< 2 seconds

Open access · RetailX Data Engineering Initiative

Kryptur OU · doi:10.5281/zenodo.20944392 · Corresponding author Raja Ram M · Zius Quantum R&D Center

Download full report

Tools + Code